Progress Measurement Methodology for the Sustainable Development Goals
Introduction
The 2030 Agenda for Sustainable Development, adopted by all United Nations Member States in 2015, provides a blueprint for improving the economy, society, and the environment in a sustainable manner. At its heart, the 17 Sustainable Development Goals (SDGs) are a universal call to action to end poverty, protect the planet, and ensure that all people globally can enjoy peace and prosperity.
The goals are underpinned by a framework of global indicators that allow countries to monitor and report on progress. They cover a broad range of social, environmental, and economic issues with a focus on the most vulnerable and a commitment to “leave no one behind”. To complement the global goals, countries are encouraged to develop a national implementation plan that focuses on country-developed indicators to address specific national contexts and priorities to achieve the SDGs.
Measuring Progress
Measuring and monitoring progress with reliable information is key to understanding how a country advances towards the achievement of the SDGs.
Closely monitoring the progress of each indicator not only shows where a country is making progress or falling behind, which helps to better focus its efforts, but also communicates how the country is performing in an open and transparent manner. A robust measure of progress quantifies an indicator’s progress towards reaching the target in a scientific manner and can be used as a tool to better understand success of policies and actions taken to achieve those targets. It can also act as a clear signal to decision-makers to readjust or develop effective evidence-based policies to help ensure the country achieves its targets.
Methodology Adopted
The Global Indicator Framework (GIF) lays the foundation for countries to measure and report their progress towards the 17 SDGs. The GIF divides the 17 SDGs across 169 targets and 234 unique indicators, all of which were agreed upon and are measured consistently by all United Nations Member States. Across the GIF, indicators may have defined quantitative targets (e.g., GIF 1.2 targets a 50% reduction of the poverty rate according to national definitions), aspirational targets (e.g., GIF target 16.5 Substantially reduce corruption and bribery in all their forms), or no target at all.
To complement the GIF and their own set of National indicators, Statistics Canada developed a robust and simple method of measuring progress which can be reported using visualizations that allow data users to easily see areas of progress or weakness. This method has been integrated into Open SDG for all it’s organisational users to make use of, including this platform. Even in the absence of specific quantitative targets, an estimate of progress can inform whether undesired trends are being observed by reporting progress deterioration. In essence, this measure of progress provides a simplified illustration of a country’s progress towards achieving the SDGs, assuming that the current trends are maintained.
Requirements
Statistics Canada identified essential requirements for the adopted methodology. The guiding principle for the methodology was the necessity of a consistent and easily interpretable measure that could reach a broad audience while maintaining scientific integrity.
More specifically, the methodology must:
- Allow for different data periodicity and timeliness: Data series available in countries have various collection calendars and reference periods. Some are collected every year while others are collected every few years. Furthermore, the time required between the collection of data and release of official statistics varies greatly between programs.
- Provide a calculation for measuring progress in the absence of a quantitative target: To gain a greater understanding of policy impacts and progress towards the achievements of the SDGs, it is crucial to be able to assess progress in the absence of a specific numerical target.
- Allow for the calculation of an aggregate measure, whether at the target, ambition, or goal level: When used appropriately, a composite measure of progress is valuable to leaders and policymakers to help steer policy and actions towards making progress to achieve the SDGs.
The adopted methodology cannot rely on:
- The need to create a target when there is none. As a statistical agency, we remain politically neutral. Therefore, it is outside the scope of our mandate to assign targets. Thus, the methodology must be valid even in the absence of a target.
- Indicator-specific thresholds for progress categories: It was assessed that using different criteria for each indicator would put too much emphasis on the method rather than the message and overall progress. Therefore, the methodology developed uses a straightforward and consistent method across all indicators.
- The existence of extended time series: Many issues covered in the SDGs haven’t been measured for an extended period. Opting for a methodology that is robust despite a shorter time series allows for a considerable increase in the number of indicators for which progress can be calculated.
- Modelling: Similar to item 3, modelling usually requires a longer time series which will reduce the number of indicators eligible for calculation of the progress measure.
Methodology
The progress measure consists of a measure of observed growth compared to an evaluation of the proximity to achieving the target under current conditions. In situations where no quantitative target is provided, the time series is evaluated on the apparent trend of the data.
Keeping in mind the limited number of data points in each time series and a desire to keep the methodology simple and transparent, the optimal methodology for measuring progress was inspired by the progress methodology used by Eurostat.[^1]
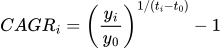
Progress is measured using the growth over the observed period and is calculated by a compound annual growth rate,
where
CAGRi is the observed compound annual growth rate between t0 and ti,
yi is the value of the indicator at time ti,
ti is the most recent year where data is available,
t0 is the base year, 2015, unless otherwise specified, and
y0 is the value of the indicator in the base year.
Indicators with quantitative targets
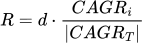
In the case where a quantitative target for the indicator is provided, the observed CAGRi is compared to the magnitude of the theoretical CAGRT, which represents the annual growth rate that would be required to achieve the target on time, by calculating the ratio (R) as follows:
where
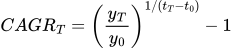
yT is the target value of the indicator in the target year, tT, and
d is +1 when the desired progress is in the positive direction and -1 when the desired progress is in the negative direction.
This formula represents the ratio of the observed growth rate compared to the growth rate required to reach the target while accounting for certain edge cases where the direction to the target differs from the desired direction of progress (e.g., some cases where the base value achieves the target).
The result is compared against a set of thresholds[^2] and assigned a progress category as described in the table below:
| Ratio of observed over required growth rate | Category | Symbol |
|---|---|---|
| Target is achieved | Target achieved |  |
| R ≥ 95% | On track |  |
| 60% ≤ R < 95% | Progress made but acceleration needed | 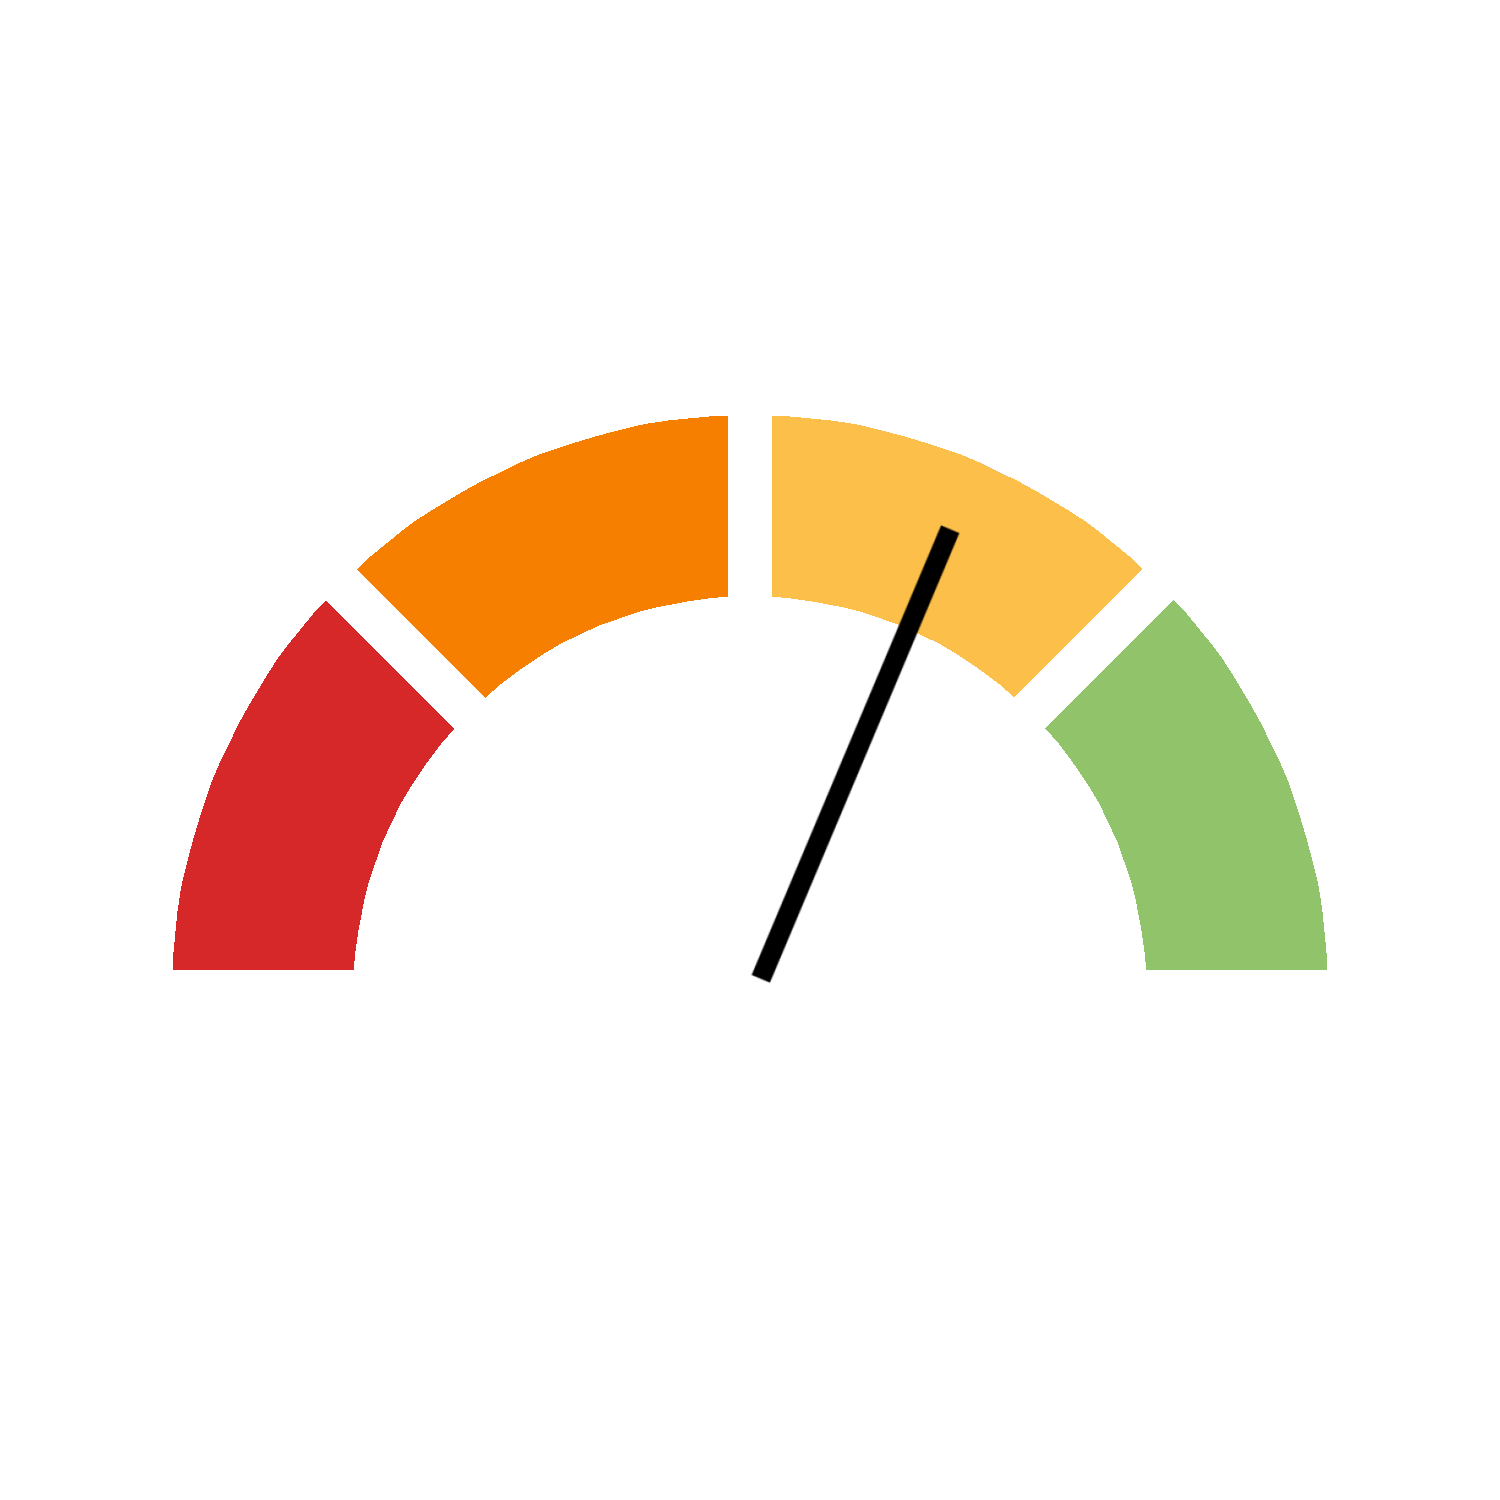 |
| 0% ≤ R < 60% | Limited progress | 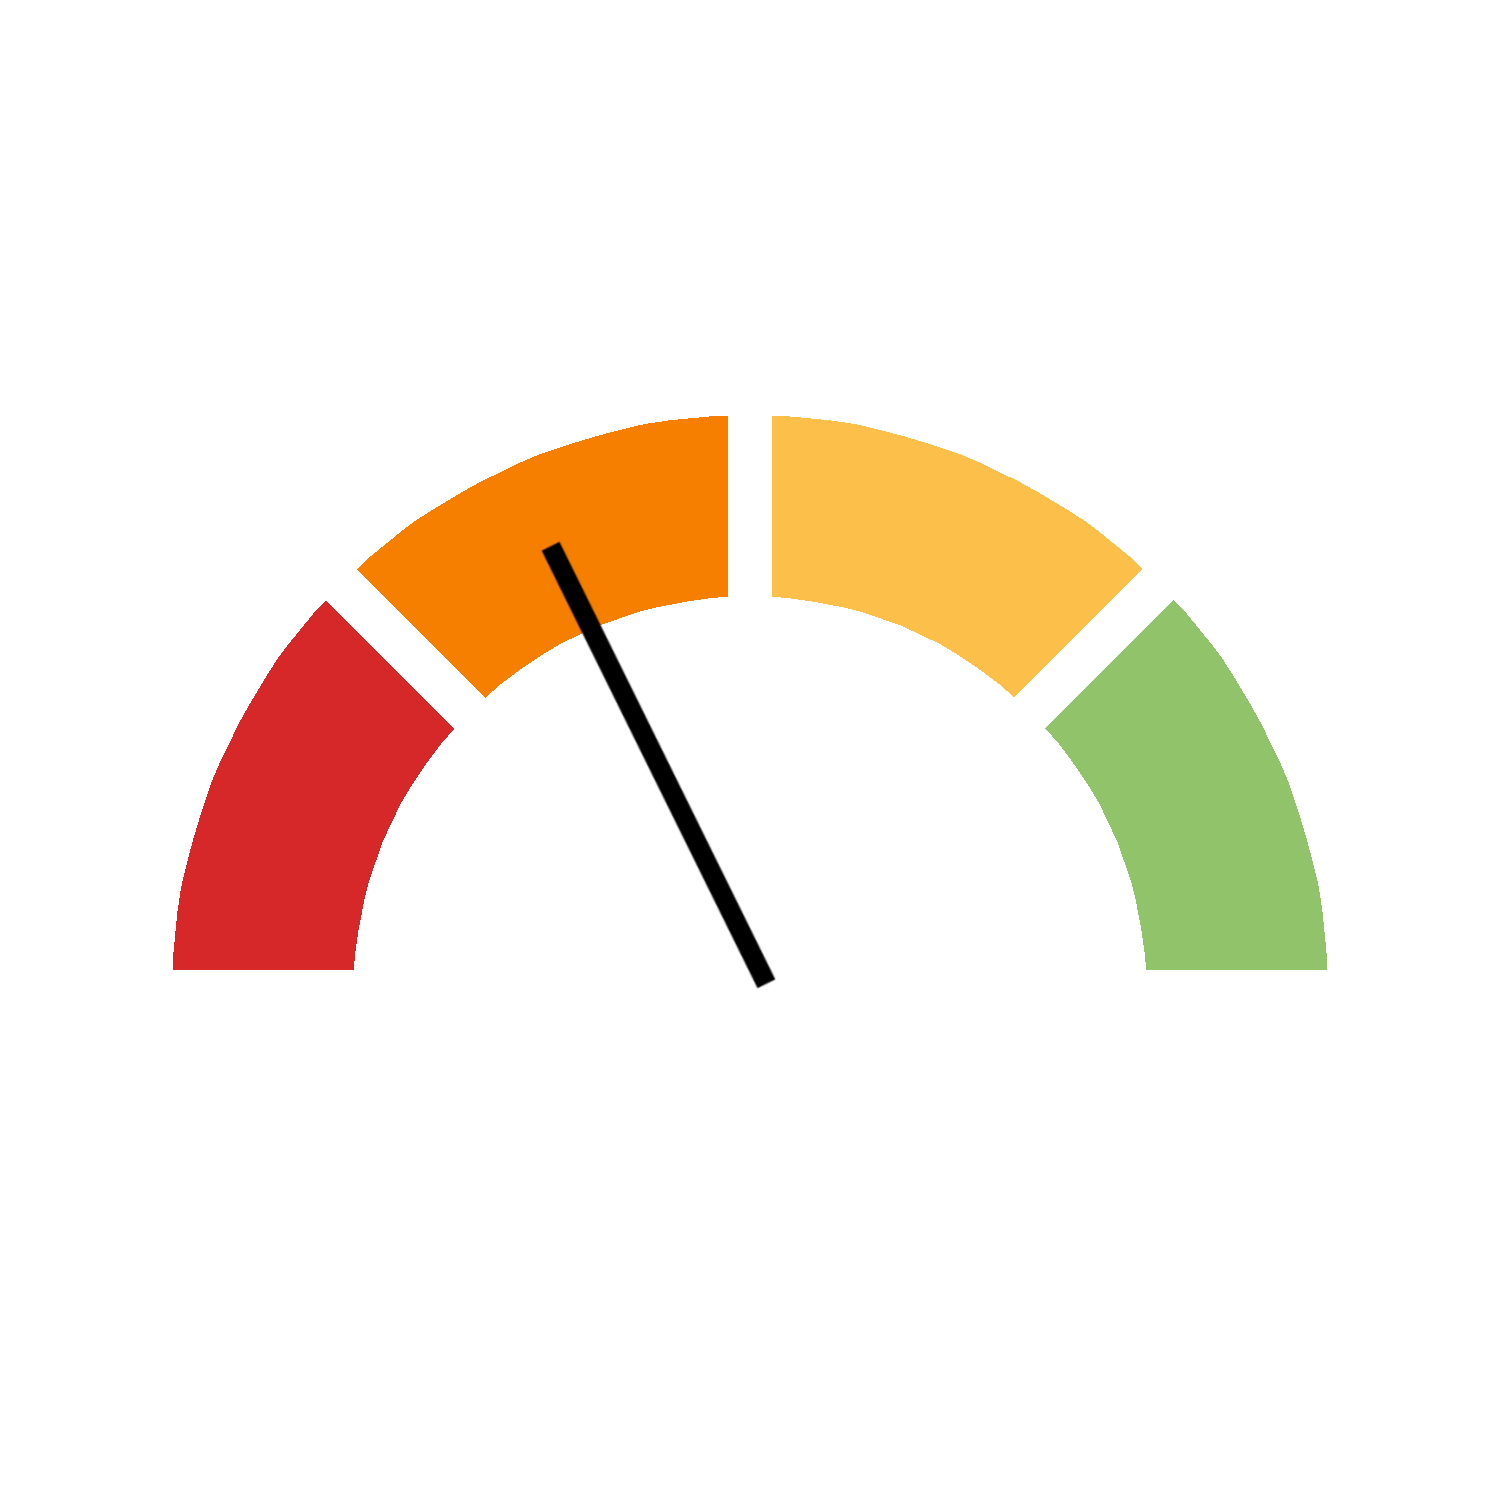 |
| R < 0% | Deterioration | 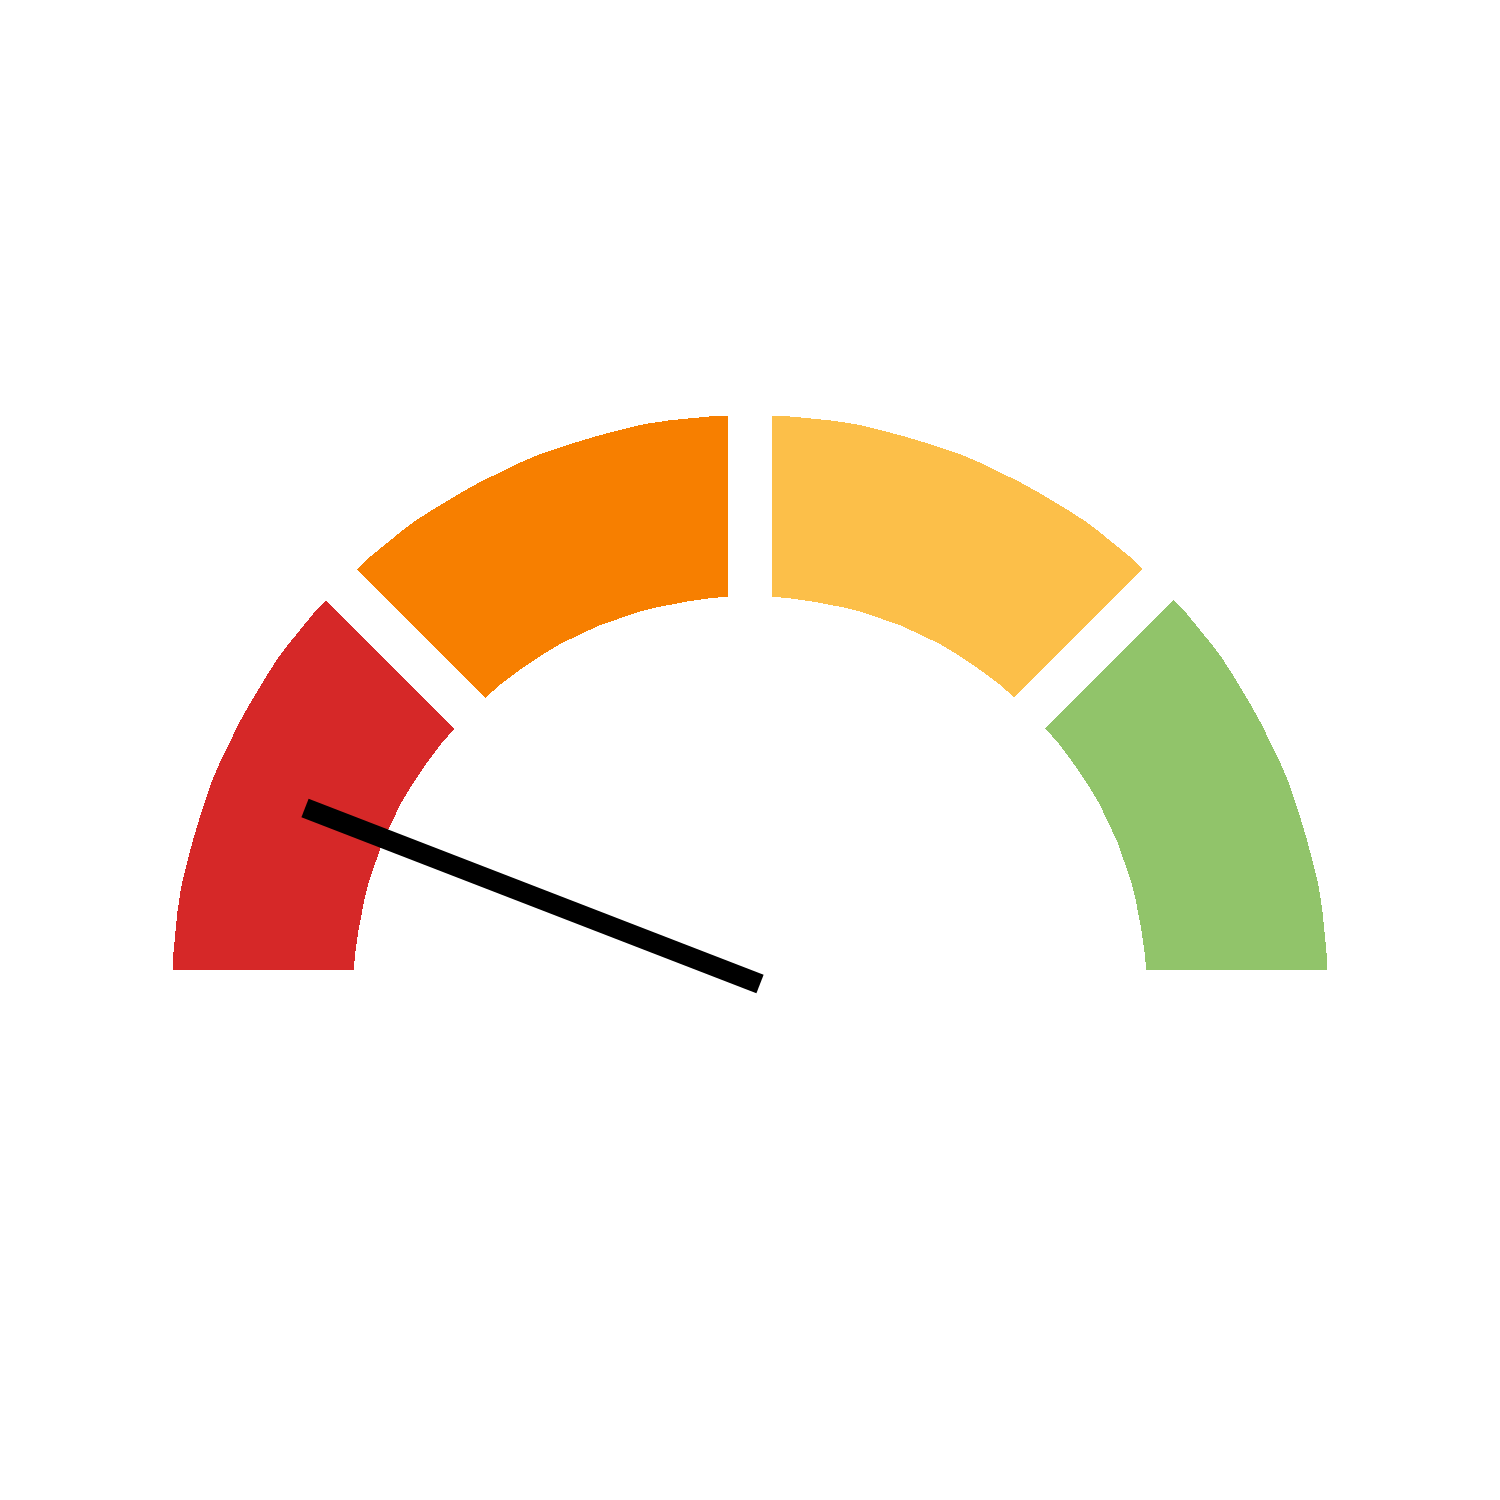 |
Indicators without quantitative targets
In the case where no quantitative target for a given indicator has been provided, the observed compound annual growth rate is compared to predetermined fixed growth rates while also accounting for the desired direction of progress.

The thresholds are described in the table below:
| Observed growth rate | Category | Symbol |
|---|---|---|
| CAGR ≥ 1.5% C* | On track | |
| 0.5% C* ≤ CAGR < 1.5% C* | Progress made but acceleration needed | |
| 0% ≤ CAGR < 0.5% C* | Limited progress | |
| CAGR < 0% | Deterioration | |
*The scaling factor C is only applied for indicators with natural limits as defined below. It is a variable between 0 and 1 that reduces thresholds greater than 0% to produce more realistic progress assessments near limits.
In some cases, indicators may have natural maximum or minimum limits. For example, GIF indicator 9.c.1 Proportion of population covered by a mobile network, by technology cannot exceed a maximum limit of 100%. If the value of the indicator in the base year is already near the natural limit, it may be impossible to achieve the growth rates required to attain a progress status of “On track” or “Progress made but acceleration needed” without exceeding the maximum limit of 100%. In these cases, the growth rate thresholds presented in the table are scaled down by a factor that accounts for the base value y0 and natural limit ylim of the indicator. Progress thresholds greater than 0% are reduced by a factor of
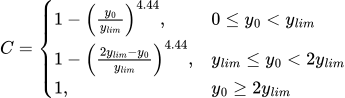
where the first case (0 ≤ y0 < ylim) covers situations with a maximum limit and the last two cases cover situations with a minimum limit. The scaling factor, C, is a variable between 0 and 1 that reduces the progress thresholds according to the proximity between the base value and the limit. If the base value is very close to the limit, C will be near zero and will aggressively reduce the thresholds to allow a more realistic range of progress assessments. Alternatively, if the base value is far from the limit, C will be near 1 and will have a minimal impact on the final progress assessment for the indicator.
The scaling factor defined above was chosen to optimally reduce the progress thresholds in a way that (1) ensures the possibility of attaining a progress status of “On track” without exceeding the limit throughout the first 15 years,[^3] (2) ensures the reduction factor is identical at equal relative distances from a minimum or a maximum limit, and (3) poses a minimal effect on the thresholds used at intermediate values and those values far away from the limit.[^4]
Only a limit that affects progress in the desired direction is considered. For example, a maximum limit is not considered for indicators whose desired direction of progress is negative. Also, the scaling factor is not applied to thresholds less than or equal to zero (thresholds ≤ 0%), which represent movement in the inverse direction from the desired direction of progress.
Aggregated progress status
In some instances, an indicator may not have an explicit headline series or may be composed of many sub-indicators of equal importance. For example, GIF indicator 5.5.1 Proportion of seats held by women in (a) national parliaments and (b) local governments provides an assortment of data series for women in various positions. In these situations, the trend of each series is considered in making a final progress assessment for the indicator as a whole.
To do so, the progress value (R for indicators with quantitative targets and CAGR for indicators without quantitative targets) for each relevant series is converted to a score. The score is obtained from a linear transformation of the progress value to a score that ranges from -5 for indicators showing substantial deterioration to +5 for indicators showing substantial progress (see Figures 1 and 2). The score range is divided equally between all four progress categories: scores between 2.5 and 5 belong to the “On track” category, scores between 0 and 2.5 belong to the “Progress made but acceleration needed” category, scores between -2.5 and 0 belong to the “Limited progress” category, and scores between -5 and -2.5 belong to the “Deterioration” category.
| Symbol | Category | Score |
|---|---|---|
|
Target achieved | 5* |
|
On track | [2.5, 5] |
|
Progress made but acceleration needed | [0, 2.5[ |
|
Limited progress | [-2.5, 0[ |
|
Deterioration | [-5, -2.5[ |
*Only applicable for indicators with quantitative targets. Indicators that achieve the target are automatically assigned a score of 5 regardless of the underlying trend.
For indicators without quantitative targets, the cut-off thresholds are 2% for a score of +5 and -2% for a score of -5 as illustrated in Figure 1 below. If applicable, thresholds greater than 0% are reduced by the scaling factor C to maintain consistency between scores for indicators with a limit and indicators without a limit.

For indicators with quantitative targets, the cut-off thresholds are 130% for a score of +5 and -60% for a score of -5 as illustrated in Figure 2 below.

The mean of the progress scores from each series is taken as the overall progress score for the indicator. The aggregate progress status is determined directly from the overall progress score according to the defined ranges of each progress category. For example, the aggregate progress status for an indicator with an overall score of +1 is “Progress made but acceleration needed”.
Any series that achieves its target is automatically assigned a progress score of +5. However, all series must achieve the target for the aggregate progress status to be “Target achieved”.
Sub-indicator grouping
In rare cases, sub-indicators may be reported via multiple series (sub-sub-indicators). In this situation, the progress scores from each series grouped within the sub-indicator are determined and averaged together before passing along the group’s mean score to be used in the next steps of the aggregate progress calculation of the indicator. For example, GIF indicator 1.4.1 Proportion of population living in households with access to basic services is composed of many sub-indicators covering access to different forms of basic services. Each basic service should be accorded equal weighting in the determination of the progress score for this indicator. However, the Access to basic education sub-indicator is itself composed of multiple sub-sub-indicators that cover a range of age groups and subjects. Therefore, the progress scores from each available sub-sub-indicator are grouped together and averaged, resulting in a single mean progress score for the Access to basic education sub-indicator. The mean of the progress scores from each sub-indicator (where some of the sub-indicators’ scores may themselves be the result of an averaged group of sub-sub-indicator scores) then becomes the final aggregate progress score for the indicator. Grouping depth is not limited. This grouping method guarantees that sub-indicators are weighted equally when assigning a progress status to the indicator.
Considerations and Exceptions
Special considerations for the base value and the target value
The progress measurement methodology uses an exponential model to evaluate the growth rate of an indicator observed to date against various thresholds. As an exponential model, it cannot handle cases where either the base value or the target is zero. Therefore, unless otherwise specified, the following replacements are performed automatically: 1. If the target value is zero, it is replaced by 0.001 in the calculation of the progress measure. 2. If the base value is zero, it is replaced by 0.001 in the calculation of the progress measure.
Generally, care should be taken to manually select an appropriate replacement value. For example, a target of zero could be replaced by a suitably small number like 1 or 0.001, but the latter is a factor of 1000 smaller than the former, which could significantly impact the final progress assessment.
Another special consideration for the base value comes when it is exactly equal to the natural limit (y0 = ylim) of an indicator without a quantitative target. In this case, the scaling factor C will be exactly zero, meaning all progress thresholds greater than 0% will be reduced to zero as well. In such a situation, if the calculated progress value is zero or greater (CAGR ≥ 0), the current value is maintained at the limit (or may even exceed the limit) and a progress status of “On track” as well as a score of +5 are assigned to the series. However, if the calculated progress value is negative (CAGR < 0), the progress score and status can be determined as usual.
Special considerations for the base year and the target year
The 2030 Agenda for Sustainable Development was adopted in 2015 to catalyse progress towards the 17 Sustainable Development Goals by 2030. As such, the base year is assumed to be 2015 and the target year is assumed to be 2030 unless specified otherwise. Even when the target results from a policy that was implemented after 2015, the base year will be 2015 when data exists unless otherwise specified. This approach ensures coherence and comparability across assessments to ensure data quality.
Should there be no available data for 2015, the first available year following 2015 will be used. In very few cases where the periodicity of the data is over 4 years or more, a base year of 2014 may be used instead. Additionally, if the reference period spans multiple years, the first year is used as the reference period. For example, the reference period 2015-16 is interpreted as the reference year 2015 in the progress calculation.
Minimum data requirements
The data must meet certain requirements in order to produce a progress assessment. 1. At least two years of data is required to calculate the progress measure. 2. As the described progress measure methodology is based on an exponential growth model, it is valid only when all values are positive or all values are negative. If all values are negative, the desired direction of progress is flipped in the progress measure calculation.
When the data for an indicator does not meet these minimum requirements, the progress status will be reported as “Unable to assess”.
In rare cases, when the relevant experts have determined that a progress assessment would hinder the interpretation of the indicator data, the progress status will instead be reported as “Not available”.
Binary indicators
Binary or non-statistical indicators are categorized as follows: 1. “Target achieved” if all conditions for meeting the target have been met. 2. “Target not achieved” if one or more conditions for meeting the target have not been met.
Interpretation
The progress assessments generated by the outlined methodology oversimplify reality. The methodology may produce better results when applied to indicators demonstrating a trend of continuous exponential growth year after year than when applied to other types of indicators. Results for indicators where the base value or the target value is zero should also be interpreted carefully due to the limitations of the underlying model. Importantly, it takes time for policies to yield measurable results. Users should interpret the reported progress status accordingly, alongside any other relevant contextual information.
Specific exceptions for Global Indicator Framework reporting
To overcome certain limitations of the progress measurement methodology, data may be transformed into an equivalent valid form before calculating progress. Such transformations are intended to enable consistent progress measurements across a greater number of indicators.
Goldilocks indicators
For some indicators, it is desirable to approach and meet the target, but exceeding it may have negative consequences. We have labelled indicators with these types of targets as “Goldilocks” indicators because being far above the target is “too cold”, being below the target is “too hot”, while achieving the target is deemed “just right”. The results improve as we approach the target and worsen as we move away from the target in either direction. The methods used to address this type of target are described below:
- GIF indicator 4.5.1 Parity indices (female/male, rural/urban, bottom/top wealth quintile and others such as disability status, indigenous peoples and conflict-affected, as data become available) for all education indicators on this list that can be disaggregated: The observed parity index value, yi, is compared to the ideal parity index value of 1. To ensure that inequities in either direction are handled fairly and equally, the observed parity index value and the ideal parity index value are compared through a ratio of one to the other. In other words, the observed values are transformed as max(yi, 1⁄yi), which corresponds to selecting whichever is larger between the ratio of the observed value to the ideal value of 1 and the reciprocal situation. Therefore, a group performing twice as well as another is measured equally to the reciprocal situation, in which a group performs half as well as the other. The desired progress is a reduction of the transformed value towards a target of 1. Furthermore, if the observed parity index value is between 0.97 and 1.03, the transformed value is simply taken to be 1 since it falls within the accepted range for parity.
- GIF indicator 5.4.1 Proportion of time spent on unpaid domestic and care work, by sex, age and location: The stated target of promoting “shared responsibility within the household and family” is interpreted as meaning the time spent on unpaid domestic and care work for men and women should be equal. As such, this indicator’s data is transformed into a measure of the ratio of the time spent on unpaid domestic and care work between men and women and assessed similarly to GIF indicator 4.5.1. The transformed value used in subsequent progress calculations is whichever is larger between the ratio of women to men and the ratio of men to women: max(fi⁄mi, mi⁄fi ), where fi represents the observed time spent by women on unpaid domestic and care work and mi represents the observed time spent by men on unpaid domestic and care work. The desired progression is a reduction towards a target ratio of 1. However, a reduction in the total time spent on domestic and care work from all genders may not be the desired outcome as it may indicate growing neglect rather than gender equality. Therefore, caution should be exercised when interpreting the progress of this indicator.
- GIF indicators 5.5.1 Proportion of seats held by women in (a) national parliaments and (b) local governments, 5.5.2 Proportion of women in managerial positions, and 5.a.1(b) Share of women among owners or rights-bearers of agricultural land, by type of tenure: Progress can be assessed by taking the absolute difference between the observed proportion, yi, and the target of 50% (gender equality), or abs(yi - 50%). Absolute differencing allows imbalances in either direction (e.g., more women in managerial positions or more men in managerial positions) to be interpreted as equally undesirable in the progress assessment. To avoid complexities that would result from zero values, we can force the absolute difference to be between 50% and 100% by transforming the observed value as 50% + abs(yi - 50%). This transformation is equivalent to reflecting any values below the target to equidistant positions on the other upper side of the target. The desired progress is a reduction of the transformed value towards a target of 50%.
- GIF indicator 8.5.2 Unemployment rate, by sex, age and persons with disabilities: Low unemployment is generally a positive economic indicator, signalling more job opportunities, higher wages, better working conditions, reduced government welfare spending, and increased tax revenue. However, extremely low unemployment rates risk negative economic outcomes as finding and retaining workers becomes more difficult and rising inflationary pressures may become significant. Thus, many economists support a natural rate of unemployment that balances good employment opportunities and inflationary pressures. To note, the natural unemployment rate may vary between countries. A natural unemployment rate of 3% is assumed and the desired progress is a reduction towards this 3% target. Due to the complex consequences of extremely low unemployment, no progress status will be produced if the unemployment rate falls below the 3% target.
- GIF indicator 16.6.1 Primary government expenditures as a proportion of original approved budget, by sector: A responsible government is expected to spend according to its approved budget, while not exceeding or failing short of the approved amount. Prior to the progress calculation, the values for this indicator can be transformed to account equally for both over- and under-spending. Similarly to GIF indicators 5.5.1, 5.5.2, and 5.a.1(b), the transformation adds the absolute difference between the observed proportion and the target to the target of 100% as follow: 100% + abs(yi - 100%), where yi is the observed proportion. This transformation ensures that the desired progress is a reduction of the transformed value towards 100%, reflecting any proportion below the target to its equivalent position above the target. Due to unpredictable outcomes below 25%, progress will not be measured in extreme situations that fall below this threshold.
Unit transformations
The methodology is not applicable to indicators that allow both negative and positive values, such as indicators measuring percent change or growth rates. When possible, the values for these types of indicators should be transformed into unit types that are compatible with the progress measurement methodology before performing the progress calculations. In the GIF, this transformation may be applied to measure the progress of the following indicators and series:
- GIF indicator 8.1.1 Annual growth rate of real GDP per capita
- GIF indicator 8.2.1 Annual growth rate of real GDP per employed person
- GIF indicator 10.1.1 Growth rates of household expenditure or income per capita among the bottom 40 per cent of the population and the total population
- GIF indicator 11.3.1 Ratio of land consumption rate to population growth rate
- GIF indicator 15.2.1 Progress towards sustainable forest management, Series: Annual forest area change rate (%)
GIF indicator 8.1.1 measures the annual growth rate of real GDP per capita as a percentage, which may be positive or negative from year to year. This type of indicator is not compatible with the progress measure methodology. However, progress can be measured using the real GDP per capita from each year. Measuring progress for this indicator based on the real GDP per capita rather than the annual growth rate of real GDP per capita is allowed as it is simply a unit transformation from a percentage growth rate to an equivalent measure in monetary amounts.
Community
The progress measure methodology described above is applied throughout this National SDG Reporting Platform. At a glance, users can interpret indicator-level progress towards a country’s Sustainable Development Goals!
Statistics Canada’s SDG team has worked with the Open SDG community to integrate the indicator-level progress measurement into the back-end of the Open SDG platform. The official release of the progress measurement functionality occurred in October 2025 with the launch of Open SDG Version 2.4.0.
Please contact Statistics Canada directly if you have any questions or want to know more about Statistics Canada’s progress measurement methodology for the Sustainable Development Goals.
Metadata
Global Indicator Framework
The table below provides the targets and desired directions used to measure a country’s progress across the GIF. All targets are interpreted at the country-level. For example, GIF indicator 12.1.1 Number of countries developing, adopting or implementing policy instruments aimed at supporting the shift to sustainable consumption and production will measure only the country’s progress rather than measuring the number of countries worldwide that have achieved the desired policy objectives.
1.1.1: Proportion of the population living below the international poverty line by sex, age, employment status and geographic location (urban/rural)
Target or desired direction: 0%
1.2.1: Proportion of population living below the national poverty line, by sex and age
Target or desired direction: Reduce by 1/2
1.2.2: Proportion of men, women and children of all ages living in poverty in all its dimensions according to national definitions
Target or desired direction: Reduce by 1/2
1.3.1: Proportion of population covered by social protection floors/systems, by sex, distinguishing children, unemployed persons, older persons, persons with disabilities, pregnant women, newborns, work-injury victims and the poor and the vulnerable
Target or desired direction: Increase
1.4.1: Proportion of population living in households with access to basic services
Target or desired direction: Increase access to basic information services; 100% for all other types of basic services
1.4.2: Proportion of total adult population with secure tenure rights to land, (a) with legally recognized documentation, and (b) who perceive their rights to land as secure, by sex and type of tenure
Target or desired direction: 100%
1.5.1: Number of deaths, missing persons and directly affected persons attributed to disasters per 100,000 population
Target or desired direction: Decrease
1.5.2: Direct economic loss attributed to disasters in relation to global gross domestic product (GDP)
Target or desired direction: Decrease
1.5.3: Number of countries that adopt and implement national disaster risk reduction strategies in line with the Sendai Framework for Disaster Risk Reduction 2015–2030
Target or desired direction: Score ≥ 0.75
1.5.4: Proportion of local governments that adopt and implement local disaster risk reduction strategies in line with national disaster risk reduction strategies
Target or desired direction: Increase
1.a.1: Total official development assistance grants from all donors that focus on poverty reduction as a share of the recipient country’s gross national income
Target or desired direction: Increase
1.a.2: Proportion of total government spending on essential services (education, health and social protection)
Target or desired direction: Increase
1.b.1: Pro-poor public social spending
Target or desired direction: Increase
2.1.1: Prevalence of undernourishment
Target or desired direction: 0%
2.1.2: Prevalence of moderate or severe food insecurity in the population, based on the Food Insecurity Experience Scale (FIES)
Target or desired direction: 0%
2.2.1: Prevalence of stunting (height for age <-2 standard deviation from the median of the World Health Organization (WHO) Child Growth Standards) among children under 5 years of age
Target or desired direction: 0%
2.2.2: Prevalence of malnutrition (weight for height >+2 or <-2 standard deviation from the median of the WHO Child Growth Standards) among children under 5 years of age, by type (wasting and overweight)
Target or desired direction: 0%
2.2.3: Prevalence of anaemia in women aged 15 to 49 years, by pregnancy status (percentage)
Target or desired direction: 0%
2.2.4: Prevalence of minimum dietary diversity, by population group (children aged 6 to 23.9 months and non-pregnant women aged 15 to 49 years)
Target or desired direction: Increase
2.3.1: Volume of production per labour unit by classes of farming/pastoral/forestry enterprise size
Target or desired direction: Increase by double
2.3.2: Average income of small-scale food producers, by sex and indigenous status
Target or desired direction: Increase by double
2.4.1: Proportion of agricultural area under productive and sustainable agriculture
Target or desired direction: Increase
2.5.1: Number of plant and animal genetic resources for food and agriculture secured in either medium- or long-term conservation facilities
Target or desired direction: Increase
2.5.2: Proportion of local breeds classified as being at risk of extinction
Target or desired direction: Decrease
2.a.1: The agriculture orientation index for government expenditures
Target or desired direction: Increase
2.a.2: Total official flows (official development assistance plus other official flows) to the agriculture sector
Target or desired direction: Increase
2.b.1: Agricultural export subsidies
Target or desired direction: 0
2.c.1: Indicator of food price anomalies
Target or desired direction: ≤ 0.5
3.1.1: Maternal mortality ratio
Target or desired direction: ≤ 70 per 100,000
3.1.2: Proportion of births attended by skilled health personnel
Target or desired direction: 100%
3.2.1: Under‐5 mortality rate
Target or desired direction: ≤ 25 per 1,000
3.2.2: Neonatal mortality rate
Target or desired direction: ≤ 12 per 1,000
3.3.1: Number of new HIV infections per 1,000 uninfected population, by sex, age and key population
Target or desired direction: 0
3.3.2: Tuberculosis incidence per 100,000 population
Target or desired direction: Reduce by 80%
3.3.3: Malaria incidence per 1,000 population
Target or desired direction: Reduce by 90%
3.3.4: Hepatitis B incidence per 100,000 population
Target or desired direction: Reduce by 90%
3.3.5: Number of people requiring interventions against neglected tropical diseases
Target or desired direction: Reduce by 90% (compared to 2010 baseline)
3.4.1: Mortality rate attributed to cardiovascular disease, cancer, diabetes or chronic respiratory disease
Target or desired direction: Reduce by 1/3
3.4.2: Suicide mortality rate
Target or desired direction: Reduce by 1/3
3.5.1: Coverage of treatment interventions (pharmacological, psychosocial and rehabilitation and aftercare services) for substance use disorders
Target or desired direction: Increase
3.5.2: Alcohol per capita consumption (aged 15 years and older) within a calendar year in litres of pure alcohol
Target or desired direction: Decrease
3.6.1: Death rate due to road traffic injuries
Target or desired direction: Reduce by 1/2
3.7.1: Proportion of women of reproductive age (aged 15–49 years) who have their need for family planning satisfied with modern methods
Target or desired direction: 100%
3.7.2: Adolescent birth rate (aged 10–14 years; aged 15–19 years) per 1,000 women in that age group
Target or desired direction: Ages 10-14: 0%; Ages 15-19: Decrease
3.8.1: Coverage of essential health services
Target or desired direction: 100%
3.8.2: Proportion of population with large household expenditures on health as a share of total household expenditure or income
Target or desired direction: 0%
3.9.1: Mortality rate attributed to household and ambient air pollution
Target or desired direction: Decrease
3.9.2: Mortality rate attributed to unsafe water, unsafe sanitation and lack of hygiene (exposure to unsafe Water, Sanitation and Hygiene for All (WASH) services)
Target or desired direction: Decrease
3.9.3: Mortality rate attributed to unintentional poisoning
Target or desired direction: Decrease
3.a.1: Age-standardized prevalence of current tobacco use among persons aged 15 years and older
Target or desired direction: Decrease
3.b.1: Proportion of the target population covered by all vaccines included in their national programme
Target or desired direction: Increase
3.b.2: Total net official development assistance to medical research and basic health sectors
Target or desired direction: Increase
3.b.3: Proportion of health facilities that have a core set of relevant essential medicines available and affordable on a sustainable basis
Target or desired direction: 100%
3.c.1: Health worker density and distribution
Target or desired direction: Increase
3.d.1: International Health Regulations (IHR) capacity and health emergency preparedness
Target or desired direction: Increase
3.d.2: Percentage of bloodstream infections due to selected antimicrobial-resistant organisms
Target or desired direction: Decrease
4.1.1: Proportion of children and young people (a) in grades 2/3; (b) at the end of primary; and (c) at the end of lower secondary achieving at least a minimum proficiency level in (i) reading and (ii) mathematics, by sex
Target or desired direction: 100%
4.1.2: Completion rate (primary education, lower secondary education, upper secondary education)
Target or desired direction: 100%
4.2.1: Proportion of children aged 24-59 months who are developmentally on track in health, learning and psychosocial well-being, by sex
Target or desired direction: 100%
4.2.2: Participation rate in organized learning (one year before the official primary entry age), by sex
Target or desired direction: 100%
4.3.1: Participation rate of youth and adults in formal and non-formal education and training in the previous 12 months, by sex
Target or desired direction: Increase
4.4.1: Proportion of youth and adults with information and communications technology (ICT) skills, by type of skill
Target or desired direction: Increase
4.5.1: Parity indices (female/male, rural/urban, bottom/top wealth quintile and others such as disability status, indigenous peoples and conflict-affected, as data become available) for all education indicators on this list that can be disaggregated
Target or desired direction: 1 (*See exceptions*)
4.6.1: Proportion of population in a given age group achieving at least a fixed level of proficiency in functional (a) literacy and (b) numeracy skills, by sex
Target or desired direction: Youth: 100%; Adults: Increase
4.7.1: Extent to which (i) global citizenship education and (ii) education for sustainable development are mainstreamed in (a) national education policies; (b) curricula; (c) teacher education; and (d) student assessment
Target or desired direction: 100%
4.a.1: Proportion of schools offering basic services, by type of service
Target or desired direction: Increase
4.b.1: Volume of official development assistance flows for scholarships by sector and type of study
Target or desired direction: Increase
4.c.1: Proportion of teachers with the minimum required qualifications, by education level
Target or desired direction: Increase
5.1.1: Whether or not legal frameworks are in place to promote, enforce and monitor equality and non‐discrimination on the basis of sex
Target or desired direction: 100%
5.2.1: Proportion of ever-partnered women and girls aged 15 years and older subjected to physical, sexual or psychological violence by a current or former intimate partner in the previous 12 months, by form of violence and by age
Target or desired direction: 0%
5.2.2: Proportion of women and girls aged 15 years and older subjected to sexual violence by persons other than an intimate partner in the previous 12 months, by age and place of occurrence
Target or desired direction: 0%
5.3.1: Proportion of women aged 20–24 years who were married or in a union before age 15 and before age 18
Target or desired direction: 0%
5.3.2: Proportion of girls and women aged 15–49 years who have undergone female genital mutilation/cutting, by age
Target or desired direction: 0%
5.4.1: Proportion of time spent on unpaid domestic and care work, by sex, age and location
Target or desired direction: Ratio = 1 (*See exceptions*)
5.5.1: Proportion of seats held by women in (a) national parliaments and (b) local governments
Target or desired direction: 50% (*See exceptions*)
5.5.2: Proportion of women in managerial positions
Target or desired direction: 50% (*See exceptions*)
5.6.1: Proportion of women aged 15–49 years who make their own informed decisions regarding sexual relations, contraceptive use and reproductive health care
Target or desired direction: 100%
5.6.2: Number of countries with laws and regulations that guarantee full and equal access to women and men aged 15 years and older to sexual and reproductive health care, information and education
Target or desired direction: 100%
5.a.1: (a) Proportion of total agricultural population with ownership or secure rights over agricultural land, by sex; and (b) share of women among owners or rights-bearers of agricultural land, by type of tenure
Target or desired direction: (a) Increase; (b) 50% (*See exceptions*)
5.a.2: Proportion of countries where the legal framework (including customary law) guarantees women’s equal rights to land ownership and/or control
Target or desired direction: Increase
5.b.1: Proportion of individuals who own a mobile telephone, by sex
Target or desired direction: Increase
5.c.1: Proportion of countries with systems to track and make public allocations for gender equality and women’s empowerment
Target or desired direction: Increase
6.1.1: Proportion of population using safely managed drinking water services
Target or desired direction: 100%
6.2.1: Proportion of population using (a) safely managed sanitation services and (b) a hand-washing facility with soap and water
Target or desired direction: 100%
6.3.1: Proportion of domestic and industrial wastewater flows safely treated
Target or desired direction: Reduce proportion of untreated wastewater by 1/2
6.3.2: Proportion of bodies of water with good ambient water quality
Target or desired direction: Increase
6.4.1: Change in water-use efficiency over time
Target or desired direction: Increase
6.4.2: Level of water stress: freshwater withdrawal as a proportion of available freshwater resources
Target or desired direction: ≤ 25%
6.5.1: Degree of integrated water resources management
Target or desired direction: 100%
6.5.2: Proportion of transboundary basin area with an operational arrangement for water cooperation
Target or desired direction: 100%
6.6.1: Change in the extent of water-related ecosystems over time
Target or desired direction: Increase
6.a.1: Amount of water- and sanitation-related official development assistance that is part of a government-coordinated spending plan
Target or desired direction: Increase
6.b.1: Proportion of local administrative units with established and operational policies and procedures for participation of local communities in water and sanitation management
Target or desired direction: Increase
7.1.1: Proportion of population with access to electricity
Target or desired direction: 100%
7.1.2: Proportion of population with primary reliance on clean fuels and technology
Target or desired direction: 100%
7.2.1: Renewable energy share in the total final energy consumption
Target or desired direction: Increase
7.3.1: Energy intensity measured in terms of primary energy and GDP
Target or desired direction: Reduce by 1/2
7.a.1: International financial flows to developing countries in support of clean energy research and development and renewable energy production, including in hybrid systems
Target or desired direction: Increase
7.b.1: Installed renewable energy-generating capacity in developing countries (in watts per capita)
Target or desired direction: Increase
8.1.1: Annual growth rate of real GDP per capita
Target or desired direction: LDC ≥ 7%; All other countries: Increase (*See exceptions*)
8.2.1: Annual growth rate of real GDP per employed person
Target or desired direction: Increase (*See exceptions*)
8.3.1: Proportion of informal employment in total employment, by sector and sex
Target or desired direction: Decrease
8.4.1: Material footprint, material footprint per capita, and material footprint per GDP
Target or desired direction: Decrease
8.4.2: Domestic material consumption, domestic material consumption per capita, and domestic material consumption per GDP
Target or desired direction: Decrease
8.5.1: Average hourly earnings of employees, by sex, age, occupation and persons with disabilities
Target or desired direction: Increase
8.5.2: Unemployment rate, by sex, age and persons with disabilities
Target or desired direction: 3% (*See exceptions*)
8.6.1: Proportion of youth (aged 15–24 years) not in education, employment or training
Target or desired direction: Decrease
8.7.1: Proportion and number of children aged 5–17 years engaged in child labour, by sex and age
Target or desired direction: 0%
8.8.1: Fatal and non-fatal occupational injuries per 100,000 workers, by sex and migrant status
Target or desired direction: Decrease
8.8.2: Level of national compliance with labour rights (freedom of association and collective bargaining) based on International Labour Organization (ILO) textual sources and national legislation, by sex and migrant status
Target or desired direction: Decrease
8.9.1: Tourism direct GDP as a proportion of total GDP and in growth rate
Target or desired direction: Increase
8.9.2: Employed persons in the tourism industries
Target or desired direction: Increase
8.10.1: (a) Number of commercial bank branches per 100,000 adults and (b) number of automated teller machines (ATMs) per 100,000 adults
Target or desired direction: Developing countries: Increase
8.10.2: Proportion of adults (15 years and older) with an account at a bank or other financial institution or with a mobile-money-service provider
Target or desired direction: 100%
8.a.1: Aid for Trade commitments and disbursements
Target or desired direction: Increase
8.b.1: Existence of a developed and operationalized national strategy for youth employment, as a distinct strategy or as part of a national employment strategy
Target or desired direction: Score = 3
9.1.1: Proportion of the rural population who live within 2 km of an all-season road
Target or desired direction: 100%
9.1.2: Passenger and freight volumes, by mode of transport
Target or desired direction: Increase
9.2.1: Manufacturing value added as a proportion of GDP and per capita
Target or desired direction: LDC: Increase by double; All other countries: Increase
9.2.2: Manufacturing employment as a proportion of total employment
Target or desired direction: LDC: Increase by double; All other countries: Increase
9.3.1: Proportion of small-scale industries in total industry value added
Target or desired direction: Increase
9.3.2: Proportion of small-scale industries with a loan or line of credit
Target or desired direction: Increase
9.4.1: CO2 emission per unit of value added
Target or desired direction: Decrease
9.5.1: Research and development expenditure as a proportion of GDP
Target or desired direction: Increase
9.5.2: Researchers (in full-time equivalent) per million inhabitants
Target or desired direction: Increase
9.a.1: Total official international support (official development assistance plus other official flows) to infrastructure
Target or desired direction: Increase
9.b.1: Proportion of medium and high-tech industry value added in total value added
Target or desired direction: Increase
9.c.1: Proportion of population covered by a mobile network, by technology
Target or desired direction: Increase
10.1.1: Growth rates of household expenditure or income per capita among the bottom 40 per cent of the population and the total population
Target or desired direction: ≥ 1
10.2.1: Proportion of people living below 50 per cent of median income, by sex, age and persons with disabilities
Target or desired direction: Decrease
10.3.1: Proportion of population reporting having personally felt discriminated against or harassed in the previous 12 months on the basis of a ground of discrimination prohibited under international human rights law
Target or desired direction: Decrease
10.4.1: Labour share of GDP
Target or desired direction: Increase
10.4.2: Redistributive impact of fiscal policy
Target or desired direction: Increase
10.5.1: Financial Soundness Indicators
Target or desired direction: Multiple
10.6.1: Proportion of members and voting rights of developing countries in international organizations
Target or desired direction: Increase
10.7.1: Recruitment cost borne by employee as a proportion of monthly income earned in country of destination
Target or desired direction: Decrease
10.7.2: Number of countries with migration policies that facilitate orderly, safe, regular and responsible migration and mobility of people
Target or desired direction: Score ≥ 3 (Meets or fully meets)
10.7.3: Number of people who died or disappeared in the process of migration towards an international destination
Target or desired direction: Decrease
10.7.4: Proportion of the population who are refugees, by country of origin
Target or desired direction: Decrease
10.a.1: Proportion of tariff lines applied to imports from least developed countries and developing countries with zero-tariff
Target or desired direction: Decrease
10.b.1: Total resource flows for development, by recipient and donor countries and type of flow (e.g. official development assistance, foreign direct investment and other flows)
Target or desired direction: Increase
10.c.1: Remittance costs as a proportion of the amount remitted
Target or desired direction: ≤ 3%
11.1.1: Proportion of urban population in core housing need
Target or desired direction: 0%
11.2.1: Proportion of population that has convenient access to public transport, by sex, age and persons with disabilities
Target or desired direction: 100%
11.3.1: Ratio of land consumption rate to population growth rate
Target or desired direction: Decrease
11.3.2: Proportion of cities with a direct participation structure of civil society in urban planning and management that operate regularly and democratically
Target or desired direction: Increase
11.4.1: Total per capita expenditure on the preservation, protection and conservation of all cultural and natural heritage, by source of funding (public, private), type of heritage (cultural, natural) and level of government (national, regional, and local/municipal)
Target or desired direction: Increase
11.5.1: Number of deaths, missing persons and directly affected persons attributed to disasters per 100,000 population
Target or desired direction: Decrease
11.5.2: Direct economic loss in relation to global GDP, damage to critical infrastructure and number of disruptions to basic services, attributed to disasters
Target or desired direction: Decrease
11.5.3: (a) Damage to critical infrastructure and (b) number of disruptions to basic services, attributed to disasters
Target or desired direction: Decrease
11.6.1: Proportion of municipal solid waste collected and managed in controlled facilities out of total municipal waste generated, by cities
Target or desired direction: Increase
11.6.2: Annual mean levels of fine particulate matter (e.g. PM2.5 and PM10) in cities (population weighted)
Target or desired direction: Decrease
11.7.1: Average share of the built-up area of cities that is open space for public use for all, by sex, age and persons with disabilities
Target or desired direction: Increase
11.7.2: Proportion of persons victim of physical or sexual harassment, by sex, age, disability status and place of occurrence, in the previous 12 months
Target or desired direction: 0%
11.a.1: Number of countries that have national urban policies or regional development plans that (a) respond to population dynamics; (b) ensure balanced territorial development; and (c) increase local fiscal space
Target or desired direction: Non-statistical
11.b.1: Number of countries that adopt and implement national disaster risk reduction strategies in line with the Sendai Framework for Disaster Risk Reduction 2015–2030
Target or desired direction: Score ≥ 0.75
11.b.2: Proportion of local governments that adopt and implement local disaster risk reduction strategies in line with national disaster risk reduction strategies
Target or desired direction: Increase
12.1.1: Number of countries developing, adopting or implementing policy instruments aimed at supporting the shift to sustainable consumption and production
Target or desired direction: Non-statistical
12.2.1: Material footprint, material footprint per capita, and material footprint per GDP
Target or desired direction: Decrease
12.2.2: Domestic material consumption, domestic material consumption per capita, and domestic material consumption per GDP
Target or desired direction: Decrease
12.3.1: (a) Food loss index and (b) food waste index
Target or desired direction: (a) Decrease; (b) Reduce by 1/2
12.4.1: Number of parties to international multilateral environmental agreements on hazardous waste, and other chemicals that meet their commitments and obligations in transmitting information as required by each relevant agreement
Target or desired direction: 100%
12.4.2: (a) Hazardous waste generated per capita; and (b) proportion of hazardous waste treated, by type of treatment
Target or desired direction: (a) Decrease; (b) 100%
12.5.1: National recycling rate, tons of material recycled
Target or desired direction: Increase
12.6.1: Number of companies publishing sustainability reports
Target or desired direction: Increase
12.7.1: Degree of sustainable public procurement policies and action plan implementation
Target or desired direction: Increase
12.8.1: Extent to which (i) global citizenship education and (ii) education for sustainable development are mainstreamed in (a) national education policies; (b) curricula; (c) teacher education; and (d) student assessment
Target or desired direction: 100%
12.a.1: Installed renewable energy-generating capacity in developing countries (in watts per capita)
Target or desired direction: Increase
12.b.1: Implementation of standard accounting tools to monitor the economic and environmental aspects of tourism sustainability
Target or desired direction: Increase
12.c.1: Amount of fossil-fuel subsidies per unit of GDP (production and consumption)
Target or desired direction: Decrease
13.1.1: Number of deaths, missing persons and directly affected persons attributed to disasters per 100,000 population
Target or desired direction: Decrease
13.1.2: Number of countries that adopt and implement national disaster risk reduction strategies in line with the Sendai Framework for Disaster Risk Reduction 2015–2030
Target or desired direction: Score ≥ 0.75
13.1.3: Proportion of local governments that adopt and implement local disaster risk reduction strategies in line with national disaster risk reduction strategies
Target or desired direction: Increase
13.2.1: Number of countries with nationally determined contributions, long-term strategies, national adaptation plans, strategies as reported in adaptation communications and national communications
Target or desired direction: Non-statistical
13.2.2: Total greenhouse gas emissions per year
Target or desired direction: Decrease
13.3.1: Extent to which (i) global citizenship education and (ii) education for sustainable development are mainstreamed in (a) national education policies; (b) curricula; (c) teacher education; and (d) student assessment
Target or desired direction: Increase
13.a.1: Amounts provided and mobilized in United States dollars per year in relation to the continued existing collective mobilization goal of the $100 billion commitment through to 2025
Target or desired direction: Increase
13.b.1: Number of least developed countries and small island developing States with nationally determined contributions, long-term strategies, national adaptation plans, strategies as reported in adaptation communications and national communications
Target or desired direction: Non-statistical
14.1.1: (a) Index of coastal eutrophication; and (b) plastic debris density
Target or desired direction: (a) Decrease; (b) Decrease
14.2.1: Number of countries using ecosystem-based approaches to managing marine areas
Target or desired direction: Non-statistical
14.3.1: Average marine acidity (pH) measured at agreed suite of representative sampling stations
Target or desired direction: Decrease
14.4.1: Proportion of fish stocks within biologically sustainable levels
Target or desired direction: 100%
14.5.1: Coverage of protected areas in relation to marine areas
Target or desired direction: ≥ 10%
14.6.1: Degree of implementation of international instruments aiming to combat illegal, unreported and unregulated fishing
Target or desired direction: Score ≥ 0.8 (Very high)
14.7.1: Sustainable fisheries as a proportion of GDP in small island developing States, least developed countries and all countries
Target or desired direction: Increase
14.a.1: Proportion of total research budget allocated to research in the field of marine technology
Target or desired direction: Increase
14.b.1: Degree of application of a legal/regulatory/ policy/institutional framework which recognizes and protects access rights for small-scale fisheries
Target or desired direction: Score ≥ 0.8 (Very high)
14.c.1: Number of countries making progress in ratifying, accepting and implementing through legal, policy and institutional frameworks, ocean-related instruments that implement international law, as reflected in the United Nations Convention on the Law of the Sea, for the conservation and sustainable use of the oceans and their resources
Target or desired direction: 100%
15.1.1: Forest area as a proportion of total land area
Target or desired direction: No change (*Country-dependent target*)
15.1.2: Proportion of important sites for terrestrial and freshwater biodiversity that are covered by protected areas, by ecosystem type
Target or desired direction: 100%
15.2.1: Progress towards sustainable forest management
Target or desired direction: Increase
15.3.1: Proportion of land that is degraded over total land area
Target or desired direction: Decrease
15.4.1: Coverage by protected areas of important sites for mountain biodiversity
Target or desired direction: 100%
15.4.2: (a) Mountain Green Cover Index and (b) proportion of degraded mountain land
Target or desired direction: (a) Increase (*Country-dependent target*); (b) Decrease
15.5.1: Red List Index
Target or desired direction: Increase (*See exceptions*)
15.6.1: Number of countries that have adopted legislative, administrative and policy frameworks to ensure fair and equitable sharing of benefits
Target or desired direction: Increase; Includes non-statistical series
15.7.1: Proportion of traded wildlife that was poached or illicitly trafficked
Target or desired direction: 0%
15.8.1: Proportion of countries adopting relevant national legislation and adequately resourcing the prevention or control of invasive alien species
Target or desired direction: Non-statistical
15.9.1: (a) Number of countries that have established national targets in accordance with or similar to Aichi Biodiversity Target 2 of the Strategic Plan for Biodiversity 2011–2020 in their national biodiversity strategy and action plans and the progress reported towards these targets; and (b) integration of biodiversity into national accounting and reporting systems, defined as implementation of the System of Environmental-Economic Accounting
Target or desired direction: (a) Non-statistical; (b) Non-statistical
15.a.1: (a) Official development assistance on conservation and sustainable use of biodiversity; and (b) revenue generated and finance mobilized from biodiversity-relevant economic instruments
Target or desired direction: (a) Increase; (b) Increase
15.b.1: (a) Official development assistance on conservation and sustainable use of biodiversity; and (b) revenue generated and finance mobilized from biodiversity-relevant economic instruments
Target or desired direction: (a) Increase; (b) Increase
15.c.1: Proportion of traded wildlife that was poached or illicitly trafficked
Target or desired direction: 0%
16.1.1: Number of victims of intentional homicide per 100,000 population, by sex and age
Target or desired direction: Decrease
16.1.2: Conflict-related deaths per 100,000 population, by sex, age and cause
Target or desired direction: Decrease
16.1.3: Proportion of population subjected to (a) physical violence, (b) psychological violence and (c) sexual violence in the previous 12 months
Target or desired direction: (a) Decrease; (b) Decrease; (c) Decrease
16.1.4: Proportion of population that feel safe walking alone around the area they live
Target or desired direction: Increase
16.2.1: Proportion of children aged 1–17 years who experienced any physical punishment and/or psychological aggression by caregivers in the past month
Target or desired direction: 0%
16.2.2: Number of victims of human trafficking per 100,000 population, by sex, age and form of exploitation
Target or desired direction: 0
16.2.3: Proportion of young women and men aged 18–29 years who experienced sexual violence by age 18
Target or desired direction: 0%
16.3.1: Proportion of victims of violence in the previous 12 months who reported their victimization to competent authorities or other officially recognized conflict resolution mechanisms
Target or desired direction: 100%
16.3.2: Unsentenced detainees as a proportion of overall prison population
Target or desired direction: Decrease
16.3.3: Proportion of the population who have experienced a dispute in the past two years and who accessed a formal or informal dispute resolution mechanism, by type of mechanism
Target or desired direction: 100%
16.4.1: Total value of inward and outward illicit financial flows (in current United States dollars)
Target or desired direction: Decrease
16.4.2: Proportion of seized, found or surrendered arms whose illicit origin or context has been traced or established by a competent authority in line with international instruments
Target or desired direction: Increase
16.5.1: Proportion of persons who had at least one contact with a public official and who paid a bribe to a public official, or were asked for a bribe by those public officials, during the previous 12 months
Target or desired direction: Decrease
16.5.2: Proportion of businesses that had at least one contact with a public official and that paid a bribe to a public official, or were asked for a bribe by those public officials during the previous 12 months
Target or desired direction: Decrease
16.6.1: Primary government expenditures as a proportion of original approved budget, by sector (or by budget codes or similar)
Target or desired direction: 100% (*See exceptions*)
16.6.2: Proportion of population satisfied with their last experience of public services
Target or desired direction: 100%
16.7.1: Proportions of positions in national and local institutions, including (a) the legislatures; (b) the public service; and (c) the judiciary, compared to national distributions, by sex, age, persons with disabilities and population groups
Target or desired direction: (a) Ratio = 1; (b) Ratio = 1; (c) Ratio = 1
16.7.2: Proportion of population who believe decision-making is inclusive and responsive, by sex, age, disability and population group
Target or desired direction: 100%
16.8.1: Proportion of members and voting rights of developing countries in international organizations
Target or desired direction: Increase
16.9.1: Proportion of children under 5 years of age whose births have been registered with a civil authority, by age
Target or desired direction: 100%
16.10.1: Number of verified cases of killing, kidnapping, enforced disappearance, arbitrary detention and torture of journalists, associated media personnel, trade unionists and human rights advocates in the previous 12 months
Target or desired direction: 0
16.10.2: Number of countries that adopt and implement constitutional, statutory and/or policy guarantees for public access to information
Target or desired direction: Score = 9
16.a.1: Existence of independent national human rights institutions in compliance with the Paris Principles
Target or desired direction: Non-statistical
16.b.1: Proportion of population reporting having personally felt discriminated against or harassed in the previous 12 months on the basis of a ground of discrimination prohibited under international human rights law
Target or desired direction: Decrease
17.1.1: Total government revenue as a proportion of GDP, by source
Target or desired direction: Increase
17.1.1: Proportion of domestic budget funded by domestic taxes
Target or desired direction: Increase
17.2.1: Net official development assistance, total and to least developed countries, as a proportion of the OECD DAC donors’ gross national income (GNI)
Target or desired direction: ≥ 0.7% to developing countries; ≥ 0.2% to LDC
17.3.1: Additional financial resources mobilized for developing countries from multiple sources
Target or desired direction: Increase
17.3.2: Volume of remittances (in United States dollars) as a proportion of total GDP
Target or desired direction: Increase
17.4.1: Debt service as a proportion of exports of goods and services
Target or desired direction: Decrease
17.5.1: Number of countries that adopt and implement investment promotion regimes for developing countries, including the least developed countries
Target or desired direction: Non-statistical
17.6.1: Fixed Internet broadband subscriptions per 100 inhabitants, by speed
Target or desired direction: Increase
17.7.1: Total amount of funding for developing countries to promote the development, transfer, dissemination and diffusion of environmentally sound technologies
Target or desired direction: Increase
17.8.1: Proportion of individuals using the Internet
Target or desired direction: 100%
17.9.1: Dollar value of financial and technical assistance (including through North-South, South‐South and triangular cooperation) committed to developing countries
Target or desired direction: Increase
17.10.1: Worldwide weighted tariff-average
Target or desired direction: 0
17.11.1: Developing countries’ and least developed countries’ share of global exports
Target or desired direction: Increase by double
17.12.1: Weighted average tariffs faced by developing countries, least developed countries and small island developing States
Target or desired direction: 0
17.13.1: Macroeconomic Dashboard
Target or desired direction: Multiple
17.14.1: Number of countries with mechanisms in place to enhance policy coherence of sustainable development
Target or desired direction: Increase
17.15.1: Extent of use of country-owned results frameworks and planning tools by providers of development cooperation
Target or desired direction: Increase
17.16.1: Number of countries reporting progress in multi-stakeholder development effectiveness monitoring frameworks that support the achievement of the sustainable development goals
Target or desired direction: Non-statistical
17.17.1: Amount in United States dollars committed to public-private partnerships for infrastructure
Target or desired direction: Increase
17.18.1: Statistical capacity indicator for Sustainable Development Goal monitoring
Target or desired direction: Increase
17.18.2: Number of countries that have national statistical legislation that complies with the Fundamental Principles of Official Statistics
Target or desired direction: Non-statistical
17.18.3: Number of countries with a national statistical plan that is fully funded and under implementation, by source of funding
Target or desired direction: Non-statistical
17.19.1: Dollar value of all resources made available to strengthen statistical capacity in developing countries
Target or desired direction: Increase
17.19.2: Proportion of countries that (a) have conducted at least one population and housing census in the last 10 years; and (b) have achieved 100 per cent birth registration and 80 per cent death registration
Target or desired direction: Non-statistical
References
Destatis. Indicator status summary.
Eurostat (2021). Sustainable development in the European Union - Monitoring report on progress towards the SDGs in an EU context.
Eurostat (2014). Getting messages across using indicators - A handbook based on experiences from assessing Sustainable Development Indicators.
Gennari, P. and D’Orazio, M. (2020). Statistical approach for assessing progress toward the SDG targets. Statistical Journal of the IAOS, 36, 1129–1142
OECD (2019). Measuring Distance to the SDG Targets - An Assessment of Where OECD Countries Stand.
UN DESA (2020). Sustainable Development Goals Progress Chart 2020 - Technical Note.
Bidarbakht Nia, A. (2017). A weighted extrapolation method for measuring the SDGs progress. UNESCAP SD Working paper series, 04, March 2017
Bidarbakht Nia, A. (2017). Tracking progress towards the SDGs: measuring the otherwise ambiguous progress. UNESCAP SD Working paper series, 05, May 2017
UNESCAP (2020). Progress Assessment Methodology.
Sachs, J., Kroll, C., Lafortune, G., Fuller, G., Woelm, F. (2021). The Decade of Action for the Sustainable Development Goals: Sustainable Development Report 2021. Cambridge: Cambridge University Press.
Notes
[^1]: For a detailed description of the methodology, please refer to Eurostat (2021).
[^2]: All thresholds are standards in the international community. After assessment, it was found that they are also applicable in the Canadian context.
[^3]: Fifteen years is the expected validity period for the methodology (generally from 2015 to 2030).
[^4]: For more details on aspects of the methodology such as the scaling factor, please contact Statistics Canada directly.