In your data repository the indicator configuration is maintained on an indicator-by-indicator basis. This indicator configuration contains fields which have specific uses in Open SDG. This page details those fields.
Note about indicator configuration file formats
By default, Open SDG platforms expect the individual indicator configuration files to be uploaded in YAML format (.yml) to the "indicator-config" folder. See this example in the data starter repo
Indicator configuration forms
Just as with the site configuration, there is a form provided to help you make changes. You can reach this form by going to an indicator page on your staging site, and then pressing "Edit Indicator", and then "Edit Configuration". Once there, you can learn about the available settings, make changes, and then download a YML file which will be ready to upload to your platform.
The alternative to using this form is to maintain your indicator configuration files by hand. This is also an option, if you are comfortable working with YAML files, but we generally recommend using the forms even so.
Note: Open SDG's indicator configuration is in a format called YAML, as mentioned above. Much of the documentation below will show examples if this YAML syntax. However, if you are using the indicator configuration forms, then you actually never need to interact with the YAML. Instead you will be making changes in the form, downloading the YAML, and then uploading it your repository directly. So, the YAML syntax examples shown below are intended to help your understanding, but do not represent anything you would actually need to type in (if you are using the indicator configuration forms).
Note about translation keys
Indicator configuration values can either be filled in with normal text ("My field value") or with translation keys (my_translations.my_translation). In the examples below, we will try to demonstrate both possibilities.
Note about unit-specific and series-specific settings
Several indicator configuration settings can be limited to a particular Unit and/or Series. For example, the graph_titles setting can be configured like this:
graph_titles:
  - unit: Percent
    title: My title for percent
  - unit: Total
    title: My title for total
Indicator setting for a specific Series-Unit combination can be configured like this:
graph_titles:
  - series: Wastewater treated
    unit: Percent
    title: My title for percent of wastewater treated
In addition to graph_titles, the other fields like this include:
- graph_annotations
- graph_limits
- graph_types
- precision
These fields are described below. Note that if a unit/series is not specified, then the item will apply to any unit/series. For example:
graph_titles:
  - series: SERIES123
    title: This title will appear for SERIES123 only
  - series: ''
    title: This title will appear for all other series
Indicator configuration fields
auto_progress_calculation
Optional: This setting is used to turn on or off the automated progress measure for the indicator. The automatic progress measurement follows Statistics Canada's progress measurement methodology. It is based upon the compound annual growth rate that has been observed in the indicator's data since 2015.
auto_progress_calculation: true
The calculated progress status is displayed on the indicator page and the goal page. Note that you will need to have set up the progress_status site configuration in the site_config.yml file before the progress status will appear. See setup and configuration details for reporting the progress status.
composite_breakdown_label
Optional This setting is used when importing data from SDMX to specify a more useful label for the COMPOSITE_BREAKDOWN column (if present). Translation keys are supported, as always. Using the example below would change the COMPOSITE_BREAKDOWN label to "Hazard type" for this indicator:
composite_breakdown_label: Hazard type
computation_units
Recommended: This setting is used to specify the unit used in the headline data for the indicator. It will display below the graph and table, on the graph y-axis, and on the graph tooltips on the indicator page. Note that this is not necessary if your indicator data contains a "Units" column.
computation_units: Metric tons
With translation key:
computation_units: my_translations.metric_tons
copyright
Optional: This setting can be used to display copyright information below the graph and table on the indicator page.
copyright: Copyright 2019 - My organisation
With translation key:
copyright: my_translations.copyright_message
Here is an example of what this looks like on the platform:
data_footnote
Optional: This setting can be used to display additional inforamtion about the data below the graph and table on the indicator page.
data_footnote: My additional information
With translation key:
data_footnote: my_translations.1-1-1-footnote
Here is an example of what this looks like on the platform:

data_non_statistical
Required: This setting is used to specify whether the indicator is statistical (can be charted/graphed) or not. If you have uploaded data that you want to display on a chart/table for an indicator, set this to false.
data_non_statistical: false
Note that in the indicator configuration form, if you toggle this on, many of the other configuration fields will be hidden, since they are not applicable to non-statistical indicators.
Here is an example of what a non-statistical indicator page looks like on the platform:
Data notices
You may want to display some very important information which site viewers must keep in mind when using the data provided. To display a notice above the graph in a coloured box, you can use the following fields within the metadata file.
Here is an example of what this looks like on the platform:
data_notice_class
Optional: This setting can be used to set the colour of a data notice using CSS classes.
data_notice_class: success
Options out-of-the-box are: * success (green) * warning (amber) * danger (red)
data_notice_heading
Optional: This setting can be used to set the title of a data notice.
data_notice_heading: Important Note
With translation key:
data_notice_heading: my_translations.important_note
data_notice_text
Optional: This setting can be used to set the text to display within a data notice.
data_notice_text: My note text
With translation key:
data_notice_text: my_translations.1-1-1-data-notice
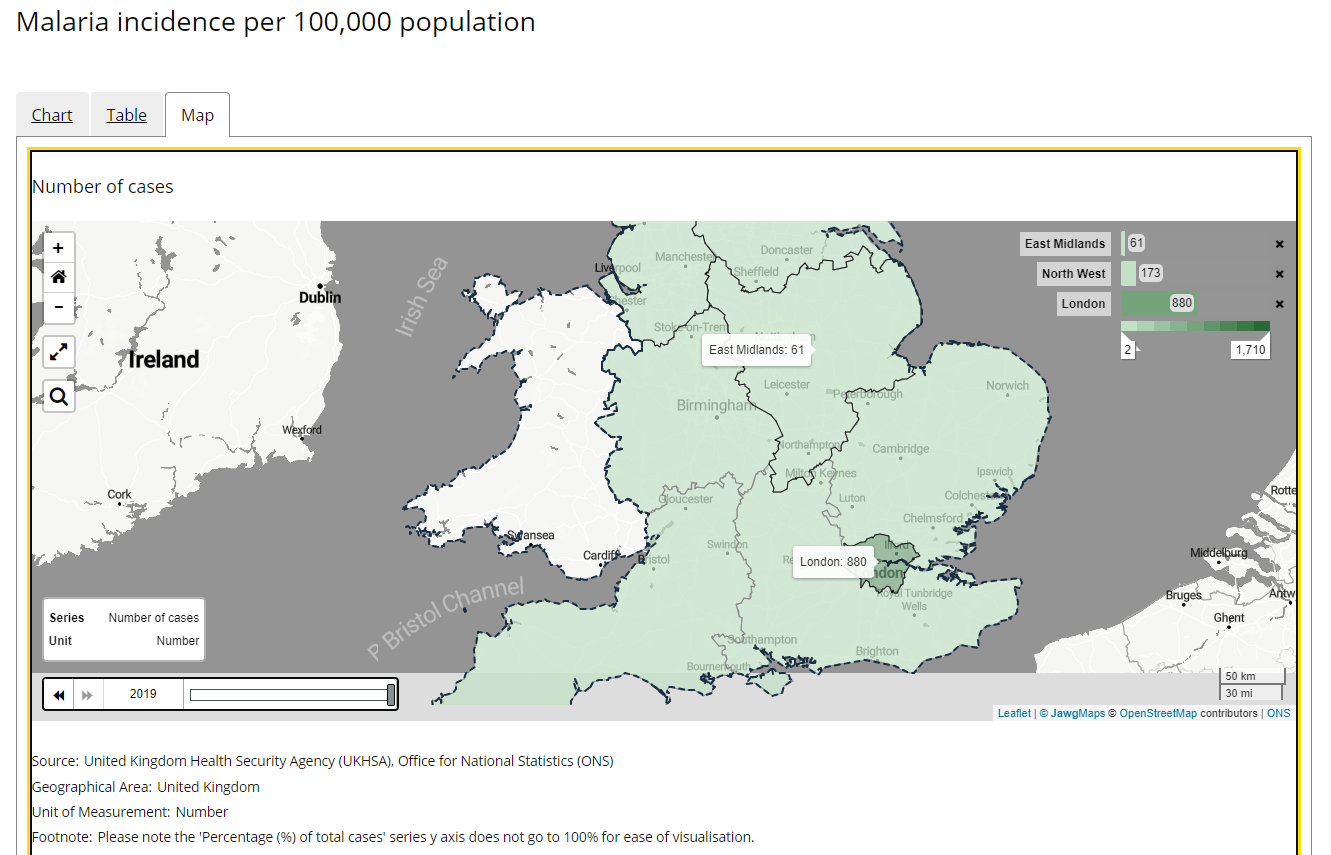
data_show_map
Optional This setting can be used to specify whether or not to display a map for the indicator, if you have configured maps. See the Maps guidance for more information on how to configure maps.
data_show_map: true
Here is an example of what this looks like on the platform:
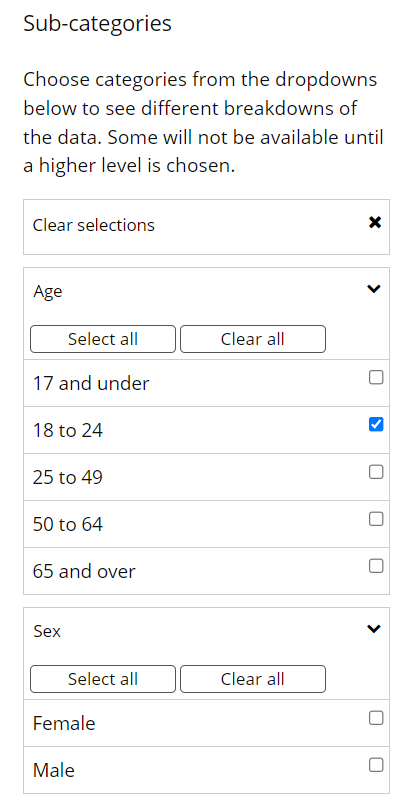
data_start_values
Optional: This setting is used to specify if you would like an indicator load with certain disaggregation values already selected. Using the example below, the indicator would load with both "Females" and "15 to 19" selected.
data_start_values:
  - field: Sex
    value: Females
  - field: Age
    value: 15 to 19
Note for multilingual implementations: both the "field" and the "value" should match what is in your data. However, if your data disaggregations are translated into other languages, then you should use translation keys here. Here is an example of how you might use translation keys:
data_start_values:
  - field: SEX.SEX
    value: SEX.F
  - field: AGE.AGE
    value: AGE.Y15T19
Embedded feature settings
You may want to add an additional feature which isn't created from data, such as an iframe. You can create an extra tab to display this feature by adding the following fields to the metadata file. You can either specify a URL (use embedded_feature_url) or some HTML (use embedded_feature_html) for the feature you want to embed.
embedded_feature_footer
Recommended (if using embedded feature): This setting can be used to specify information about an embedded feature which displays below embed.
embedded_feature_footer: This graph is provided by "My Organisation"
embedded_feature_html
Required (if not using embedded_feature_url when using embedded feature): This setting can be used to specify HTML code of the feature that you want to embed. You may use this when you don't have control of the original feature that you want to embed, and so need to make some changes e.g. to the size, title, or other attributes.
embedded_feature_html: <iframe width="1110" height="700" title="Childhood Vaccination Coverage Statistics" src="https://app.powerbi.com/view?r=eyJrIjoiZTI3NWZhNzItMTIyZS00OWM2LTg0MzMtOGY5YTJjMGY0MjI1IiwidCI6IjUwZjYwNzFmLWJiZmUtNDAxYS04ODAzLTY3Mzc0OGU2MjllMiIsImMiOjh9&pageName=ReportSection" frameborder="0" allowFullScreen="true"></iframe>
Here is an example of what this looks like on the platform:
embedded_feature_tab_title
Required (if using embedded feature): This setting can be used to specify the text that will display on the tab which your embedded feature will display within.
embedded_feature_tab_title: Embedded Chart
embedded_feature_title
Recommended (if using embedded feature): This setting can be used to specify the title to be shown above the embedded feature
embedded_feature_title: My embedded chart
embedded_feature_url
Required (if not using embedded_feature_html when using embedded feature): This setting can be used to specify the the URL of feature that you want to embed. You may use this when you have control over the original feature that you want to embed, and don't need to make any changes e.g. if the feature is already the correct size.
embedded_feature_url: http://example.com/embed-1-1-1.html
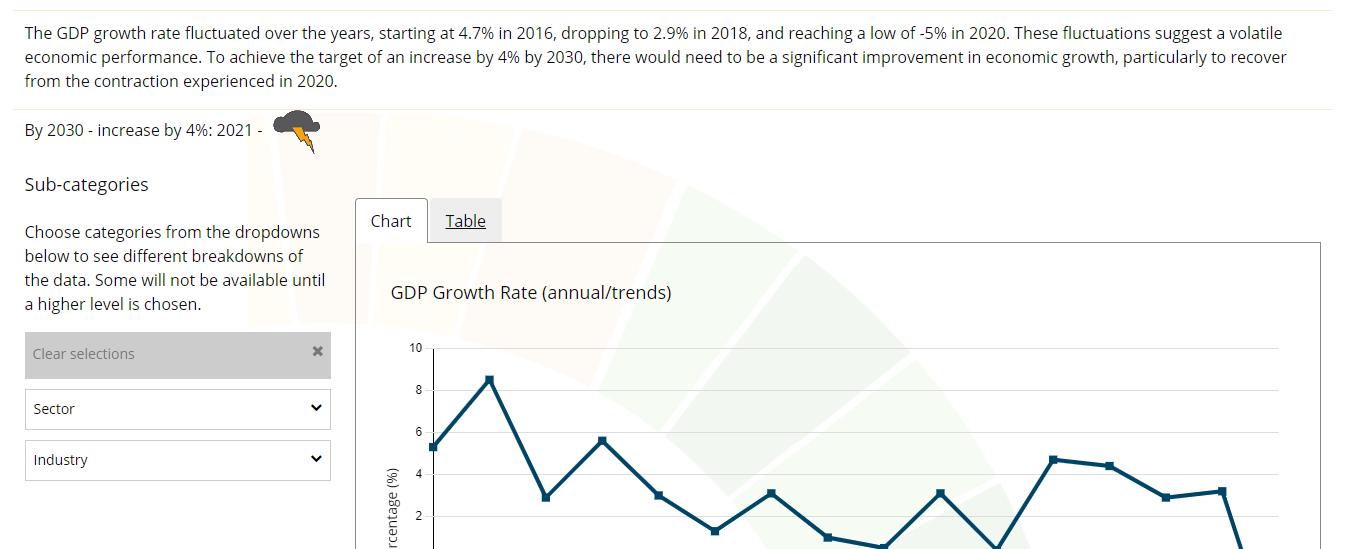
expected_disaggregations
Optional: This setting is used to supply metrics to the disaggregation status report (see the reporting_status site configuration). It should contain a list of the disaggregations (i.e. columns in the CSV file) that the indicator should have.
expected_disaggregations:
  - Age
  - Sex
Here is an example of what this looks like on the platform:
footer_fields
Optional: This setting is used to add any arbitrary footer fields beneath the chart/table. These display under the other footer field settings, like copyright and data_footnote.
This setting should include a list of items, each containing at least a label (which can be a translation key) and value. For example:
footer_fields:
  - label: My field label
    value: My field content
  - label: My other field label
    value: My other field content
You can also limit items to a particular unit or series. For example:
footer_fields:
  - unit: percentage
    label: My field for percentages
    value: My field content
  - unit: total
    label: My field for totals
    value: My other field content
Here is an example of what this looks like on the platform:
graph_annotations
Optional: Note that this setting is quite complex, and is not recommended unless you really need a particular type of graph annotation. For much simpler alternatives specifically designed for the most common use-cases, see the graph_target_lines and graph_series_breaks settings.
This setting can be used to add line annotations to the graph, such as target lines to show the progress towards the 2030 goal for an indicator (though, again, there is a separate graph_target_lines setting specifically designed for target lines). Like graph_titles it can include multiple annotations, and limited to particular units or series. Each item can have the following settings:
* `series`: If specified, the annotation will only display when the user is looking at this series.
* `unit`: If specified, the annotation will only display when the user is looking at this unit of measurement.
* `value`: Used for line annotations. The value at which to draw the line. For horizontal lines, this number corresponds to your actual data. For vertical lines, this number should be between 0 (the left side of the chart) and the number of years minus 1 (the right side of the chart). See [Chart.js documentation](https://github.com/chartjs/chartjs-plugin-annotation/blob/master/README.md) for details.
* `endValue`: Used for line annotations. Optional value at which the line ends. See [Chart.js documentation](https://github.com/chartjs/chartjs-plugin-annotation/blob/master/README.md) for details.
* `description`: Either a string or function returning a description of the annotation. This is necessary for accessibility, as the description is read by screenreaders. The description does not appear visually on the page.
* `mode`: Can be "vertical" or "horizontal". See [Chart.js documentation](https://github.com/chartjs/chartjs-plugin-annotation/blob/master/README.md) for details.
* `borderColor`: The color of the line/box. See [Chart.js documentation](https://github.com/chartjs/chartjs-plugin-annotation/blob/master/README.md) for details.
* `borderDash`: The type of dashes for a line. See [Chart.js documentation](https://github.com/chartjs/chartjs-plugin-annotation/blob/master/README.md) for details.
* `label`: Additional settings for controlling the label:
    * `position`: Can be "top", "bottom", "left", "right", or "center". See [Chart.js documentation](https://github.com/chartjs/chartjs-plugin-annotation/blob/master/README.md) for details.
    * `content`: The text of the label (can be a translation key). See [Chart.js documentation](https://github.com/chartjs/chartjs-plugin-annotation/blob/master/README.md) for details.
    * `fontColor`: The color of the label text. See [Chart.js documentation](https://github.com/chartjs/chartjs-plugin-annotation/blob/master/README.md) for details.
    * `backgroundColor`: The background color of the label text. See [Chart.js documentation](https://github.com/chartjs/chartjs-plugin-annotation/blob/master/README.md) for details.
* `highContrast`: Overrides of the color-related settings described above (`borderColor`, and the label's `fontColor` and `backgroundColor`) for when the user is in high-contrast mode. For examples see [the javascript file containing presets](https://github.com/open-sdg/open-sdg/blob/HEAD/_includes/components/charts/annotation_presets.js).
* `preset`: A "preset" is a pre-bundled set of configurations. The only available preset is `target_line`. For examples see [the javascript file containing presets](https://github.com/open-sdg/open-sdg/blob/HEAD/_includes/components/charts/annotation_presets.js). Note that you can use a preset and also override any of that preset's individual settings.
This is an example of using annotations
```nohighlight graph_annotations: - unit: tons value: 19 borderColor: red - unit: passengers value: 1900 borderColor: red
This is an example of using the `target_line` preset:

 ```nohighlight
graph_annotations:
  - unit: tons
    value: 19
    preset: target_line
  - unit: passengers
    value: 1900
    preset: target_line
Here is an example of what this looks like on the platform:
graph_limits
Optional: This setting can be used to control the lowest/highest values to be shown on the y-axis by specifying min/max limits. Optionally they can refer to a specific unit of measurement or series. Note that this involves a slightly more complex metadata structure.
graph_limits:
  - unit: tons
    minimum: 2
    maximum: 20
  - unit: passengers
    minimum: 200
    maximum: 2000
Here is an example of what this looks like on the platform:
graph_series_breaks
Optional: This setting can be used to add "series break" annotations (ie, gaps in the years) to the graph. Like graph_titles it can include multiple items, and each can be limited to particular units or series. Each item can have the following settings:
* `series`: If specified, the series break will only display when the user is looking at this series.
* `unit`: If specified, the series break will only display when the user is looking at this unit of measurement.
* `label_content`: The text to display on the annotation. Defaults to "Series break".
* `value`: The value at which to draw the line. This number should be between 0 (the left side of the chart) and the number of years minus 1 (the right side of the chart).
Note that this setting relies on the Chart.js annotation plugin. If you would like to tweak any other settings for more site-wide control, you can override the _includes/components/charts/annotation_presets.js file.
To show a series break midway between 2013 and 2014 on a graph which has years 2005 - 2018, the value would be 2013.5-2005 = 8.5
graph_series_breaks:
  - value: 8.5
or to specify per units/series:
graph_series_breaks:
  - unit: My computation units name
    value: 8.5
graph_series_breaks:
  - series: My series name
    value: 8.5
Here is an example of what this looks like on the platform:
graph_stacked_disaggregation
Optional: This setting can be used with the "bar" graph type to place a certain disaggregation (such as "Age") into the same "stacked" bars.
graph_stacked_disaggregation: Age
This setting is most appropriate for cases where the data are disaggregated among percentages that add up to 100. For example, if the data are disaggregated among "Female" and "Male", and each year the two measurements add up to 100, this stacked disaggregation works well.
Here is an example of what this looks like on the platform:
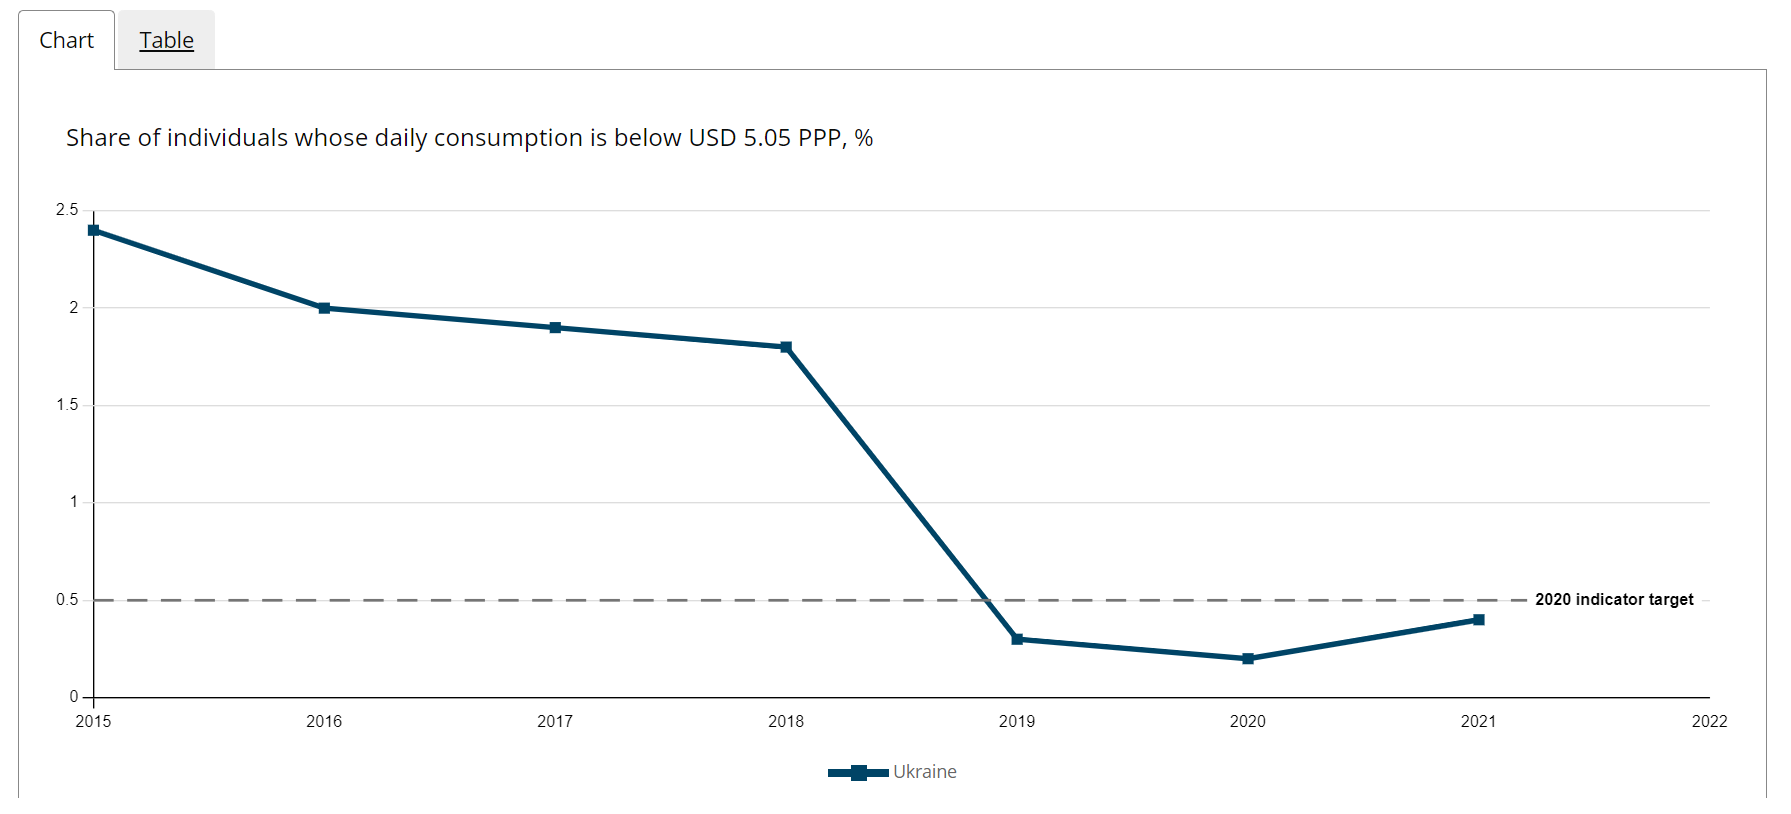
graph_target_lines
Optional: This setting can be used to add "target line" annotations to the graph. Like graph_titles it can include multiple items, and each can be limited to particular units or series. Each item can have the following settings:
* `series`: If specified, the target line will only display when the user is looking at this series.
* `unit`: If specified, the target line will only display when the user is looking at this unit of measurement.
* `label_content`: The text to display on the annotation. Defaults to "2030 target".
* `value`: The value at which to draw the line. This number corresponds to your actual data.
Note that this setting relies on the Chart.js annotation plugin. If you would like to tweak any other settings for more site-wide control, you can override the _includes/components/charts/annotation_presets.js file.
graph_target_lines:
  - value: 2.5
or to specify per units/series:
graph_target_lines:
  - unit: My computation units name
    value: 2.5
graph_target_lines:
  - series: My series name
    value: 2.5
Here is an example of what this looks like on the platform:
graph_title
Required (for statistical indicators): This setting is used to specify the title that displays above the graph/chart. This can be simple text (or a translation key) if you would like the chart title to be the same for all units of measurement.
graph_title: My graph title for 1.1.1
With translation key:
graph_title: my_translations.1-1-1-graph_title
graph_titles
Required (for statistical indicators): This setting is used if you would like the chart title to depend on the user-selected unit of measurement. It has a more complex structure than graph_title (singular)
graph_titles:
          - unit: Percent
            title: My title for percentages
          - unit: Total
            title: My alternate title for totals
Note: To use the currently-selected series as the chart title (where possible), set the site configuration option graph_title_from_series to true.
graph_type
Required (for statistical indicators that don't use the alternative "graph_types" setting): This setting is used to specify what type of graph to use for the indicator. More information about charts here.
graph_type: line
Options out-of-the-box are:
- line
- bar
- binary (Yes/No graph)
graph_types
Required (for statistical indicators that don't use the alternative "graph_type" setting): This setting is used if you would like the chart type to depend on the user-selected unit of measurement or series. It has a more complex structure than graph_type (singular). For example:
graph_types:
  - unit: Percent
    type: line
  - unit: Total
    type: bar
indicator_available
Recommended: This setting is intended for use when the global indicator name might not accurately describe the available national/regional statistics. It should provide an alternate name for the indicator. If specified it will display just below the indicator banner.
indicator_available: A more suitable name for the data that is provided
indicator_name
Required: This setting is used to specify the name of the indicator, which displays at the top of the indicator page.
indicator_name: Proportion of population living below the national poverty line, by sex and age
With translation key:
indicator_name: global_indicators.1-2-1-title
indicator_number
Required: This setting is used to specify the number (or "id") for the indicator.
indicator_number: 1.2.1
indicator_tabs
Optional: This setting controls the order and contents of the data tabs on indicator pages. This only needs to be used on indicators where you would like to override the indicator_tabs site configuration setting.
Note that the override parameter is necessary in order for this indicator-specific override to be used.
For example, if you would like a particular indicator to start on the map tab, you could do this:
indicator_tabs:
  override: true
  tab_1: map
  tab_2: chart
  tab_3: table
  tab_4: embed
For more details on how to use this setting, see the indicator_tabs site configuration setting.
national_geographical_coverage
Required (for statistical indicators): This setting is used to specify what label should be used in the absence of any disaggregation (i.e. for headline data)
national_geographical_coverage: Australia
With translation key:
national_geographical_coverage: my_translations.australia
page_content
Optional: This setting can be use to add content (e.g. tables, lists, links, headings, etc.) above the graph near the top of the screen. This is a useful place to add information about an indicator that doesn't fit in with the rest of the metadata.
See this guide to writing Markdown.
page_content: My additional information about the indicator
Here is an example of what this looks like on the platform:
permalink
Optional: This setting can be used to control the URL of a standalone indicator. This does not require any preceding/trailing slashes. See the standalone metadata field below for information on how to set an indicator as standalone.
permalink: my-custom-indicator-path
placeholder
Optonal: This setting can be used to give the indicator some placeholder text, which is displayed on goal pages instead of a link to an indicator page. The result is that users will only see the placeholder text, and will not be viewing the indicator page. This also hides the indicator from any reporting status calculations, so it will not affect the Reporting Status page.
placeholder: My placeholder text
Translation keys can also be used.
placeholder: custom.my-placeholder-for-1-1-1
precision
Optional: This setting is used to force a particular number of decimal places.
Note: Normally trailing zeroes are removed from decimals before being displayed. For example, "23.60" will be displayed as "23.6".
The example below could be used to force "23.60" to actually display as "23.60". Along the same lines, "23" would display as "23.00".
precision:
  - decimals: 2
You can also specify multiple precisions, and each one can apply to a particular unit and/or series. Here is an example if you want to force a precision of 2 on "percentage" units, and a precision of 1 on "total" units:
precision:
  - unit: percentage
    decimals: 2
  - unit: total
    decimals: 1
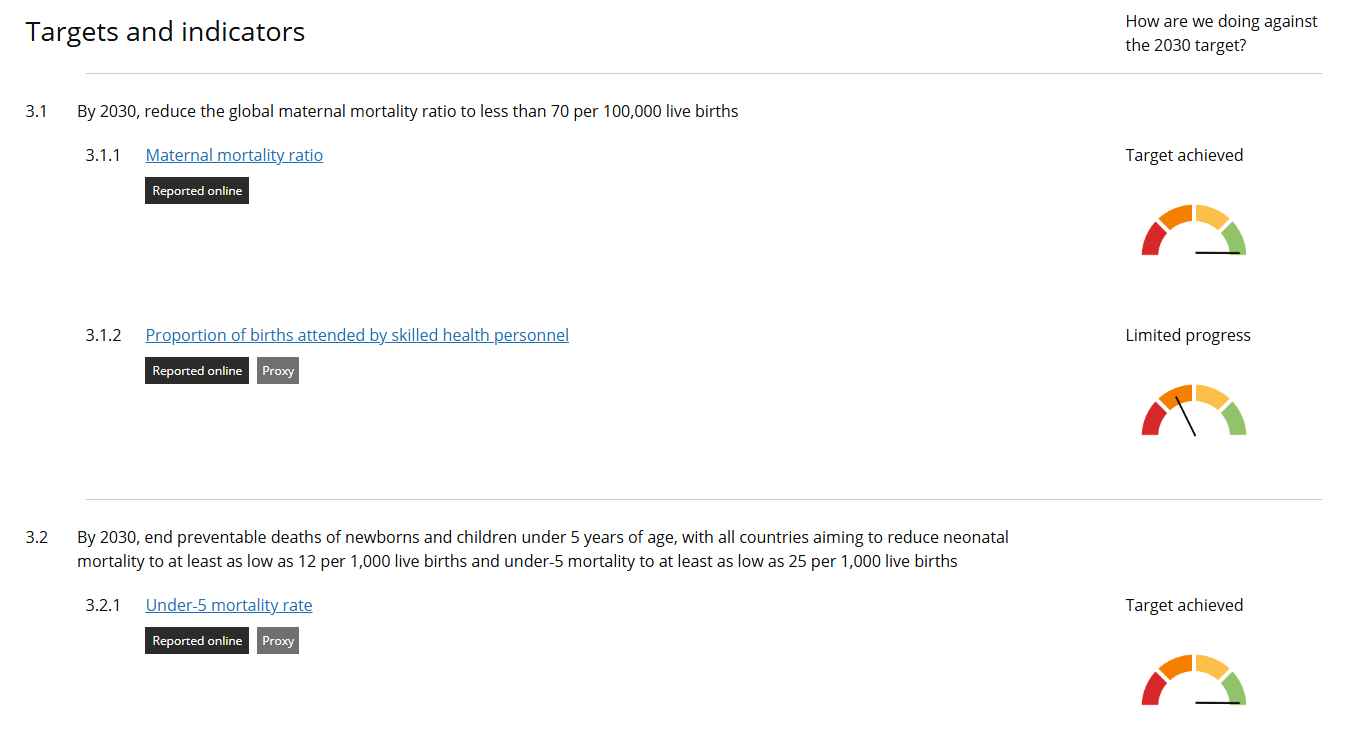
progress_status
Optional: This setting is used to manually specify the status of the indicator's progress when the automated progress calculation is not turned on (auto_progress_calculation: false).
progress_status: target_achieved
The specified progress status is displayed on the indicator page and the goal page. Note that you will need to have set up the progress_status site configuration in the site_config.yml file before the progress status will appear. See setup and configuration details for reporting the progress status.
Options out-of-the-box are:
- not_available
- limited_progress
- moderate_progress
- substantial_progress
- target_achieved
Here is an example of what this looks like on the platform:
progress_calculation_options
Optional: If the automated progress calculation is turned on (auto_progress_calculation: true). This controls the input parameters for the progress calculation. A progress status and score are determined for the indicator using a methodology based on compound annual growth rates (see the Progress Status page or Statistics Canada's progress measurement methodology for more details).
A progress score can only be determined for individual time series within the data. If the data has many possible time series (for example: multiple series, units, or disaggregations), the individual time series to use for the progress calculation must be specified in progress_calculation_options using the series, unit, and disaggregation parameters. It is also possible to specify multiple time series, which will calculate the progress scores for each of these time series individually and the overall progress status will correspond to the mean score of each of the specified time series.
series: The series name of the time series for the progress calculation. This only needs to be specified where there is more than one series. Take care to write the series the same way as is in your data.unit: The unit name of the time series for the progress calculation. This only needs to be specified where there is more than one type of unit. Take care to spell the unit the same way as is in your data.disaggregation: If the selected time series has no headline, a particular disaggregation may be selected with this setting. Ifdisaggregationis not specified and a headline is present, the headline values will be selected for the progress calculation.direction: "negative" or "positive". Default: "negative". The desired direction of progress for the time series which is always required for the progress calculation. So when there is a numerical target, a direction should also be specified (else the default “negative” is used).base_year: Default: 2015. The base year for the progress calculation of the specified time series. Note that if you have data displaying before the base year it will not be included in the progress calculation. For consistency in reporting progress over the period of the SDGs (2015-2030), it is recommended to only change the base year where necessary e.g. if your data collection frequency for an indicator is not annual and the start of the collection period falls just before 2015, you might use 2014 instead.target_year: Default: 2030. The target year for the progress calculation of the specified time series.target: Default: None. The value required to reach the target of the specified time series. It is recommended that these are taken from the standardised list of targets for each indicator as described in the UN SDG metadata and summarised in this table. Where there is a numerical target, a direction should also be specified in the field above. Where some targets in the table have exceptions or are country-dependent, countries should customise as best relevant. If an alternative target is used, for transparency, it is recommended to explain this in your national metadata on the relevant indicator page. Cannot be zero - a target of zero will be automatically reset to 0.001. Note: When the desired target is zero, it is recommended to manually specify a replacement target value that is sufficiently small to represent a near-zero target in the context of the data. The automatic replacement by 0.001 may be overly aggressive if the data lacks correspondingly high precision. Consider more realistic replacement target values (e.g. 0.01, 0.1) for less precise datasets or datasets with larger values.limit: Default: None. If direction is "positive", this is the maximum possible ceiling for the values of the specified time series. If direction is "negative", this is the minimum possible floor for the value of the specified time series. For example, the limit of SDG 9.c.1 'Proportion of population covered by a mobile network, by technology' should be 100 since no more than 100% of the population can be covered by a mobile network. Only applicable if no target is specified.
Here is an example of a simple indicator with a quantitative target – e.g. 3.1.1 Maternal mortality ratio which has a target of ≤ 70 per 100,000 as established in the UN SDG metadata and found in the metadata table:
auto_progress_calculation: true
progress_calculation_options:
- direction: negative
  target: 70
Here is an example specifying a single time series from an indicator with multiple series and disaggregations. This example tells the progress measurement tool to only include data from the time series falling under the following categories: Series = Fatality claims, Geography = Canada, Gender = Male. There is no prescribed target, but a negative direction.
auto_progress_calculation: true
progress_calculation_options:
- series: Fatality claims
  disaggregation:
  - field: Geography
    value: Canada
  - field: Gender
    value: Male
  direction: negative
Here is another example where multiple time series from the indicator data are specified. The overall progress status for the indicator in this example will correspond to the mean progress scores of these two time series: fatality claims for males in Canada and fatality claims for females in Canada. There are also two different units and one has a limit as an example, the other has a target.
auto_progress_calculation: true
progress_calculation_options:
- series: Fatality claims
  disaggregation:
  - field: Geography
    value: Canada
  - field: Gender
    value: Male
  direction: negative
  unit: percentage
  limit: 0
- series: Fatality claims
  disaggregation:
  - field: Geography
    value: Canada
  - field: Gender
    value: Female
  direction: negative
  unit: persons per thousand
  target: 85
It is also possible to group equally-weighted time series together. In the following example, the overall progress status for the indicator is obtained from the mean of the progress scores for lost time claims and fatality claims, with each group weighted equally. Within the fatality claims group, the progress score is derived from two equally-weighted sub-series: fatality claims for males in Canada and fatality claims for females in Canada.
auto_progress_calculation: true
progress_calculation_options:
- series: Lost time claims
  direction: negative
- group:
  # Grouped time series are weighted equally
  - series: Fatality claims
    disaggregation:
    - field: Geography
      value: Canada
    - field: Gender
      value: Male
    direction: negative
  - series: Fatality claims
    disaggregation:
    - field: Geography
      value: Canada
    - field: Gender
      value: Female
    direction: negative
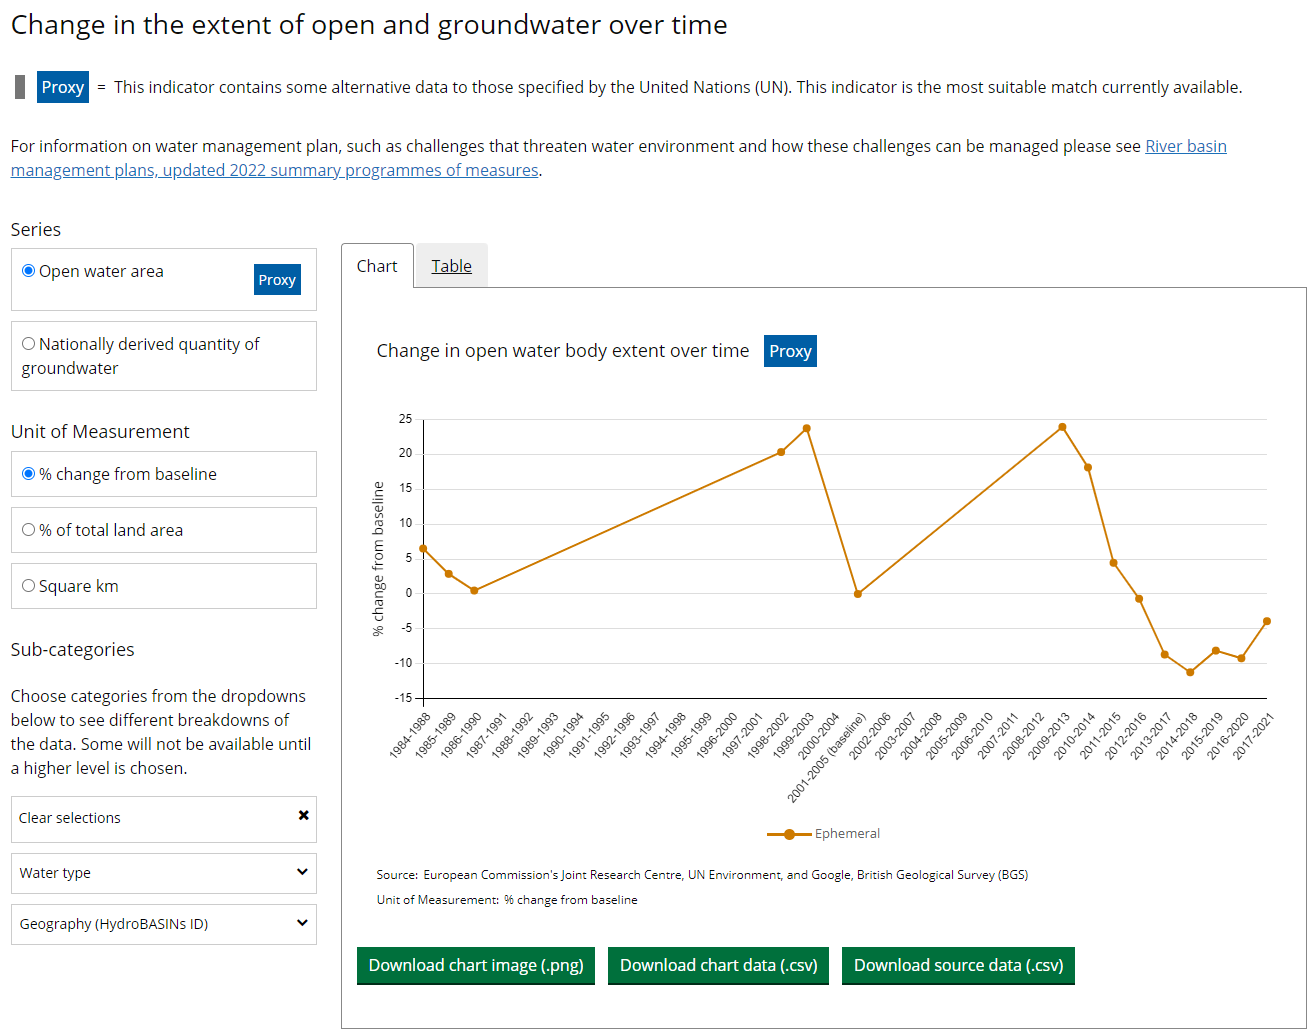
proxy
Optional: When indicator data provided is alternative to that specified by the UN, Open SDG now has the functionality to mark it as "proxy" data. The feature provides a label and customizable definition and can be set for an entire indicator of for an individual series within an indicator. The available settings for this are:
proxy: proxy
Using "proxy" will flag the entire indicator as a proxy.
proxy: both
Using "both" can flag particular series codes within the indicator as proxies. This requires that you also set the proxy_series option below.
Here is an example of what this looks like on the platform:
proxy_series
This setting is required if you have proxy set to "both". It should be a list of the series codes within the indicator that you want flagged as "proxy" data. For example:
proxy: both
proxy_series:
  - my first series code
  - my other series code
publications
Optional: This setting can be used to store details about related publications for an indicator. These can be displayed by having an item in your metadata_tabs site configuration with a scope of publications. It can contain any number of publication items, each of which should have a title and a link, and optionally a description (which can contain markdown) and/or date. Here is an example of the usage:
publications:
  - title: My publication title
    link: "https://example.com/path/to/my/file"
    description: My publication description
    date: 1953-08-12
  - title: My other publication
    link: "https://example.com/path/to/my/other/file"
    description: Another publication description
    date: 2022-01-01
Notice the date must be in the format: YYYY-MM-DD.
related_indicators
Optional: This setting can be used to control the indicators listed in the "Related indicators" tab on indicator pages. It can contain any number of indicator ID numbers. Here is an example of the usage:
Optional: This setting can be used to specify which other indicators are related to this one. These can be displayed by having an item in your metadata_tabs site configuration with a scope of related_indicators. It can contain any number of indicator ID numbers. Here is an example of the usage:
related_indicators:
  - 1.1.1
  - 1.2.1
reporting_status
Required: This setting is used to specify the status of the indicator. This feeds into the reporting status page and also displays on the goal pages.
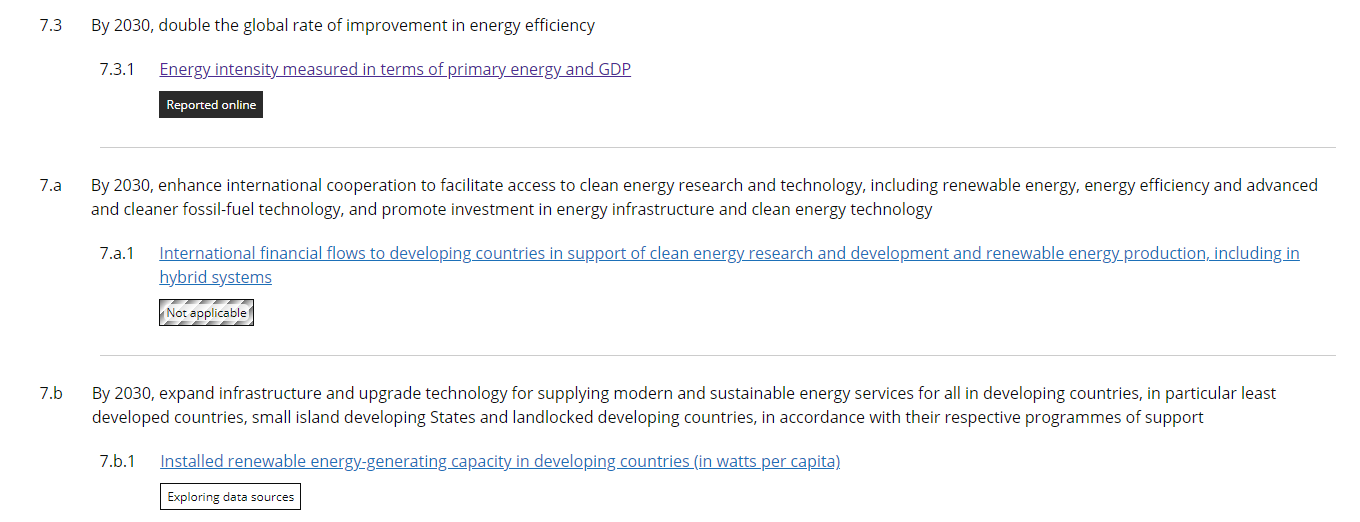
Importantly, this also determines whether a chart and table will appear on the indicator page. If the reporting_status is not complete, the chart and table will NOT appear.
reporting_status: complete
Options out-of-the-box are:
- complete
- inprogress
- notstarted
- notapplicable
Here is an example of what this looks like on the platform:
sort
Optional: This setting can be used to override this automatic ordering for a particular indicator by setting sort in the metadata for that indicator.
The order in which indicators are displayed in lists is determined behind the scenes, according to the indicator number. This is done by automatically converting the indicator number to a string which sorts correctly when alphabetized. (For example, indicator 1.2.1 gets sorted as '010201'.) The example below shows how this setting could be used to make 1.2.1 appear at the end of goal 1, target 2.
sort: 0102zz
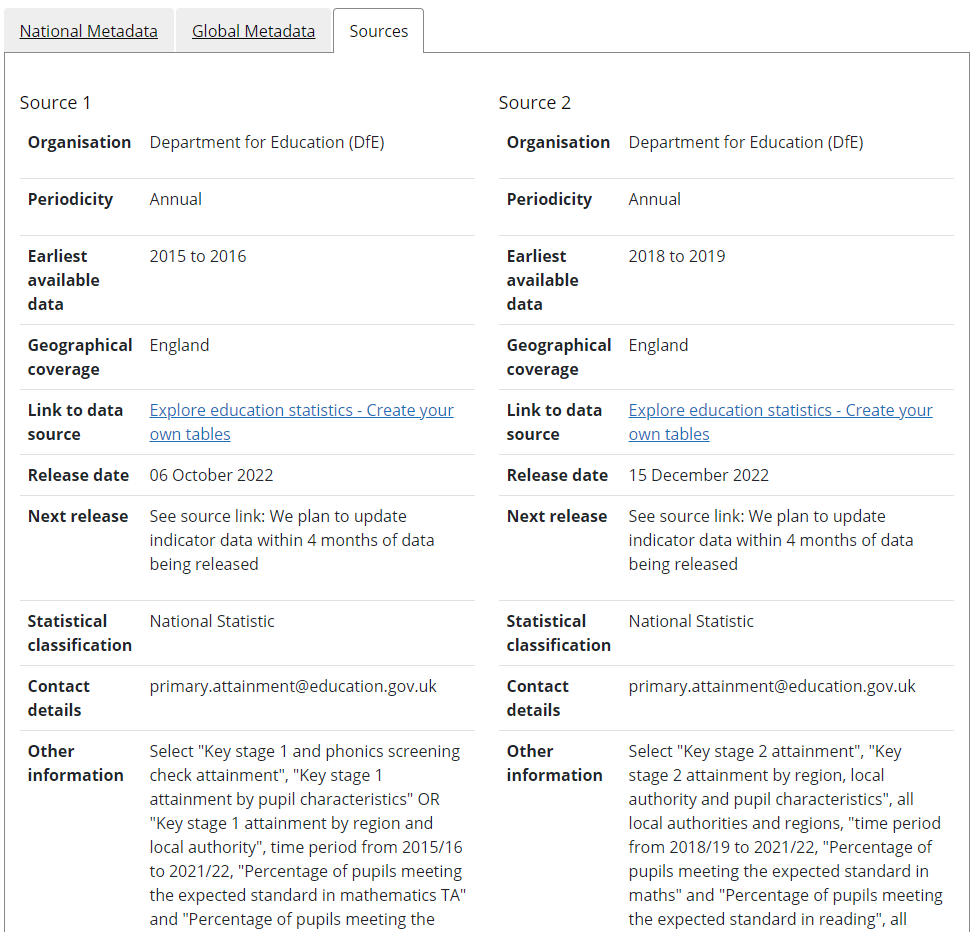
sources
Optional: This setting can be used to store details about the sources of data for an indicator. These can be displayed by having an item in your metadata_tabs site configuration with a scope of sources_alt. It can contain any number of source items, each of which can have any of the following fields:
- organisation
- periodicity
- earliest_available
- geographical_coverage
- url (should be a URL to a website)
- url_text (controls the link text to use for the
urlabove) - release_date
- next_release
- statistical_classification
- contact
- other_info
- logo (should be a URL to an external image, or a path to one in the site repository)
Here is an example of the usage:
sources:
  - organisation: House of Commons Library
    periodicity: Discontinuous
    earliest_available: "1918"
    geographical_coverage: United Kingdom
    url: "https://commonslibrary.parliament.uk/research-briefings/sn01250/"
    url_text: Women in Parliament and Government
    release_date: 04/03/2022
    next_release: TBC
    statistical_classification: Official Statistic
    contact: hcinfo@parliament.uk
    other_info: "This is *some* markdown."
    logo: "https://onsdigital.github.io/sdg-indicators/assets/img/SDG_logo.png"
Here is an example of what this looks like on the platform:
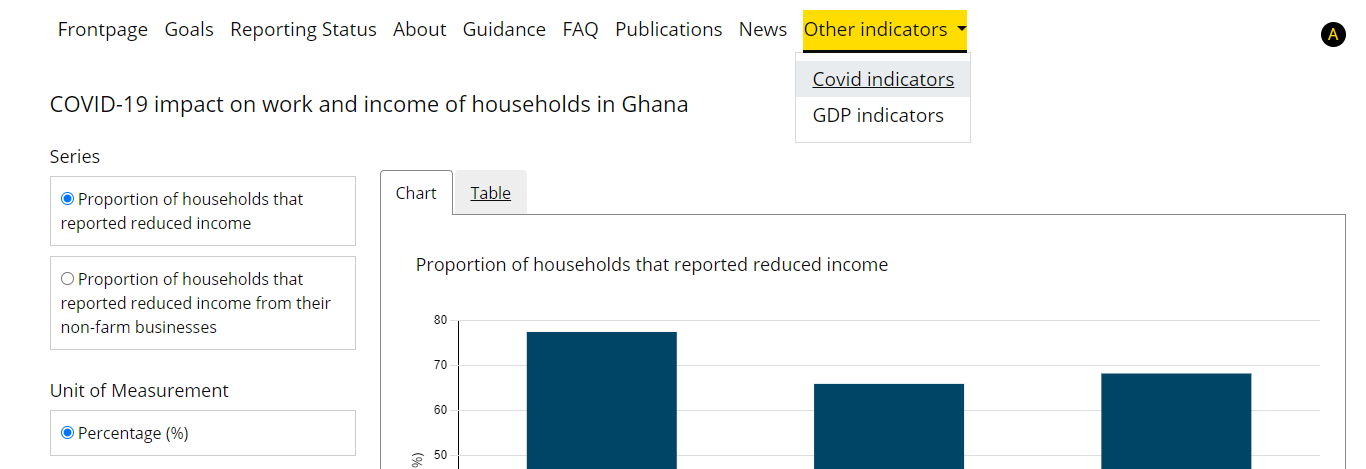
standalone
Optional: This setting can be used to set the indicator as standalone which will prevent it from appearing as part of a goal, and keeps the indicator off the reporting status, disaggregation status, and other disaggregation reports. It is useful if you would like to post statistical indicators that are not part of the SDGs (such as Covid-19 data).
standalone: true
In this case you may also want to control the URL of the indicator. You can do this with the permalink metadata field (see above).
If you want to create a listing page for your standalone indicators you can do so in the _pages folder of your site repository. For more details on how to create pages, see the create_pages guidance. It is recommended the following configuration is used on your created page:
layout: standalone-indicators
Here is an example of what this looks like on the platform:
tags
Optional: This setting is used to supply a list of "tags" to display under the indicator when it is listed on its goal page
tags:
  - My tag
  - My other tag
Note that each tag will receive a unique HTML class, according to the content of the tag. For example, a tag called "National" will receive an HTML class of "tag-national". This gives you precise control of the styling of each individual tag, through the use of custom CSS.
Additionally, the default color of the tags can be controlled by changing the $tag-backgroundColor Sass variable.
Here is an example of what this looks like on the platform:

x_axis_label
Optional: This setting, if provided, will display as a label beneath the X axis on charts. Note that this overrides the same setting in the site configuration.
Here is an example of what this looks like on the platform: